Annual report 2014
Since 1886
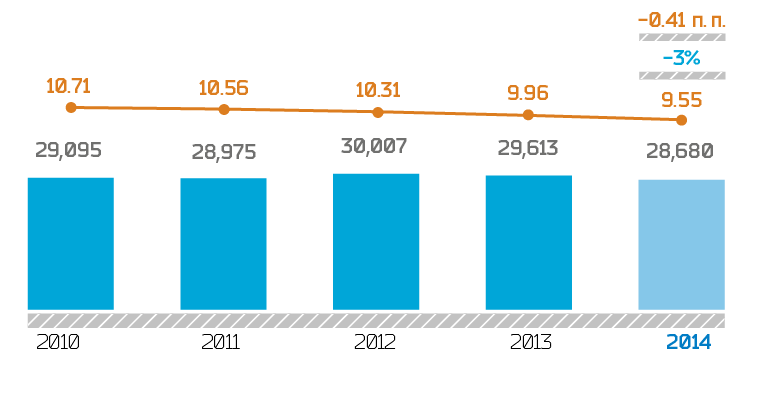
The percent of electricity losses in Lenenergo networks in 2014 in comparable conditions, taking into account the transition to metering of supply to the grid according to AIMS CEM, was 0.41 percentage points below the level of 2013 (9.55% in 2014 versus 9.96 % in 2013).
In 2014, due to the implementation of the energy saving Program losses were lowered by 4% to productive supply in the grid in comparable conditions. For comparison, in 2013 and 2012 the indictor dropped by 2.5%. In terms of money, savings for the Company in 2014 totaled RUB 964 mln, exceeding the economic effect of 2013 by RUB 212 mln, or 28%.
The year-on-year decrease in productive supply by 3% was due to the cancellation in 2014 of the so-called “last mile” mechanism on the territory of St. Petersburg and the Leningrad Region, and the transition of some consumers to direct contracts with FGC UES. In 2014, productive supply was up by 487 mln kWh compared to 2013 in comparable conditions (including consumers of the so-called “last mile”).
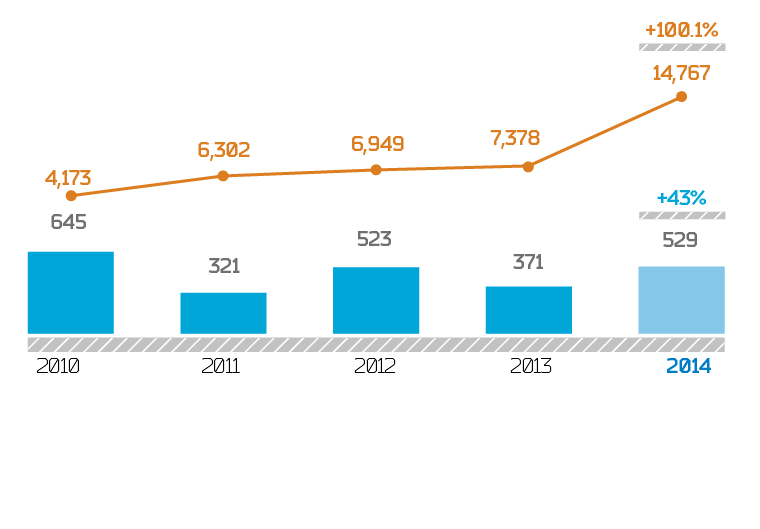
In 2014, Lenenergo connected 14,767 applicants, exceeding 2 times the same indicator of 2013. The increase in the number of executed obligations in 2014 was primarily due to the contracts towards applicants within the territory of the Leningrad Region: the growth accounted for 115 %. The volume of connected capacity increased by 43%
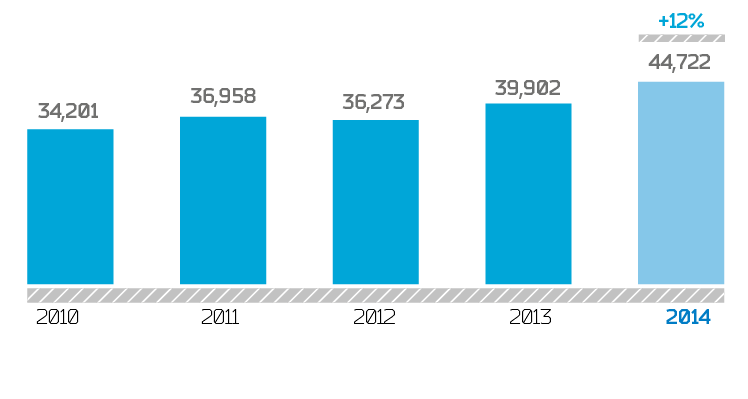
The revenue growth in 2014 concerning the fact of 2013 was noted on all types of activity. The revenue growth from electricity transmission services accounted for 9.2% that was mainly caused by the increase in the average tariff by 12.7% compared to the joint-operations tariffs of 2013. Revenue growth from technological connection services was 26.6% caused by implementation of the accumulated obligations towards applicants, and existence in the structure of revenue for 2014 of the contracts with major applicants.
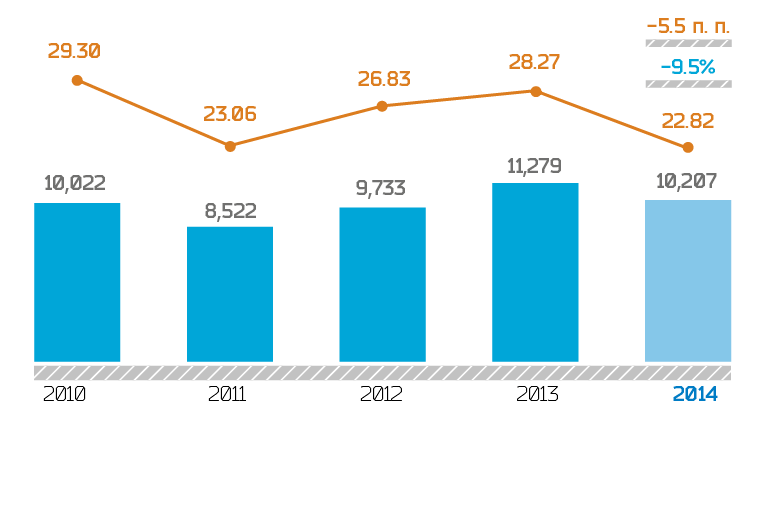
High margin of EBITDA adjusted for non-cash items demonstrates a consistently high level of operational efficiency of the Company.
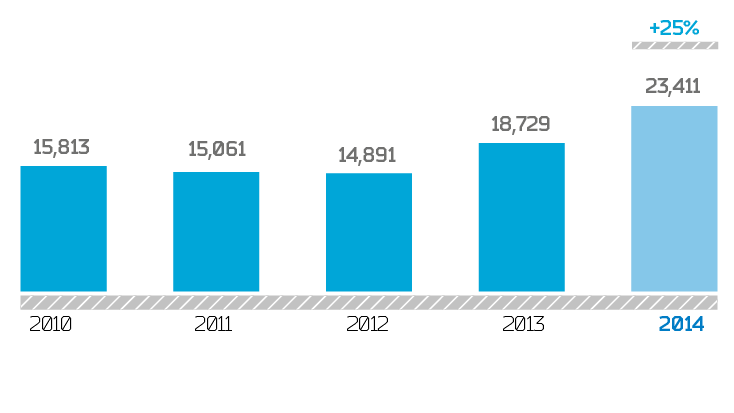
In 2014, CAPEX increased by 25% and commissioning of fixed assets in monetary terms was up by 30% mainly due to the performance of work under contracts for technological connection on the accumulated obligations, including towards a preferential category of citizens, and implementation of measures to ensure the renovation of the Company’s grid assets, including the target program of Complex development of the grids of the Petrogradsky District of St. Petersburg financed by the federal budget.
| Indicator | Unit | 2010 | 2011 | 2012 | 2013 | 2014 | 2014/2013,%,(unless,otherwise,specified) |
|---|---|---|---|---|---|---|---|
| Operating indicators | |||||||
| Productive electricity supply | mln kWh | 29,095 | 28,975 | 30,007 | 29,613 | 28,680 | –3.2 |
| Electricity losses | % | 10.71 | 10.60 | 10.37 | 10.11 | 11.06 | 9.4 |
| Connected capacity | MW | 645 | 321 | 523 | 771 | 694 | –10.0 |
| — generating facilities | 0 | 0 | 0 | 400 | 150 | –62.5 | |
| — other | 645 | 321 | 523 | 371 | 529 | 42.6 | |
| — connections on temporary schemes of power supply | — | — | — | 0 | 15 | — | |
| Financial indicators | |||||||
| Sales revenue, including: | RUB mln | 34,201 | 36,958 | 36,273 | 39,902 | 44,722 | 12.1 |
| from electricity transmission | RUB mln | 23,873 | 28,475 | 28,816 | 33,207 | 36,261 | 9.2 |
| from technological connection | RUB mln | 10,164 | 8,311 | 7,282 | 6,515 | 8,249 | 26.6 |
| from other industrial activity | RUB mln | 164 | 172 | 175 | 180 | 212 | 17.8 |
| Cost | RUB mln | 27,758 | 31,758 | 32,830 | 36,429 | 39,257 | 7.8 |
| Gross profit | RUB mln | –6,442 | –5,201 | 3,443 | 3,473 | 5,466 | 57.4 |
| Profit before tax | RUB mln | –5,012 | –2,311 | 1,962 | 1,444 | –8,793 | –708.9 |
| Net profit | RUB mln | –3,535 | –1,367 | 1,042 | 425 | –7,968 | — |
| ROE (return on equity) is calculated according to the methodology recommended by Department of corporate finance of JSC Rosseti at preparation of the annual report for 2014: (Net profit / Equity capital)*100 % = [l. 2400 f.2 / ((l. 1300 f.1 report + l. 1300 d.1 base) / 2))*100%.ROE | % | 7.08 | 2.54 | 1.57 | 0.56 | –10.78 | — |
| EBITDA is calculated as: EBITDA = Net profit + Profit tax + Depreciation + Interest payable — Interest receivable + Provision for impairment of debt investments = l. 2400 f.2 + Depreciation + Profit tax f.2 + l. 2330 f.2 — l. 2320 f.2 + Provision for impairment of debt investments.EBITDA | RUB mln | 10,022 | 8,522 | 9,733 | 11,279 | 10,207 | –9.5 |
| EBITDA margin | % | 29.30 | 23.06 | 26.83 | 28.27 | 22.82 | –5.5 p.p. |
| Debt to equity ratio | — | 1.39 | 1.09 | 1.42 | 1.06 | 0.77 | –27.4 |
| Net debt is calculated as the sum of long-term and short-term debt funds (lines of balance 1410 and 1510), including debt on interest minus cash and short-term investments.Net debt | % | 14,405 | 20,197 | 22,360 | 23,722 | 45,546 | 92.0 |
| Net debt/EBITDA | — | 1.44 | 2.37 | 2.3 | 2.1 | 4.46 | — |
| Market indicators | |||||||
| Market capitalization (on MICEX Stock Exchange) | RUB mln | 27,372 | 11,139 | 7,759 | 3,742 | Capitalization is calculated including the placed shares of additional issue, SRN 1-01-00073-A-003D.3,967 | 6.0 |
| P/E is calculated as the average cost of one ordinary share as at the end reporting year/profit per share.P/E | — | 7 | 7.2 | 6.8 | 7 | –0.4 | — |
| Investments | |||||||
| The volume of deployment is reflected w/o VATCAPEX | RUB mln | 15,813 | 15,061 | 14,891 | 18,729 | 23,411 | 25,0 |
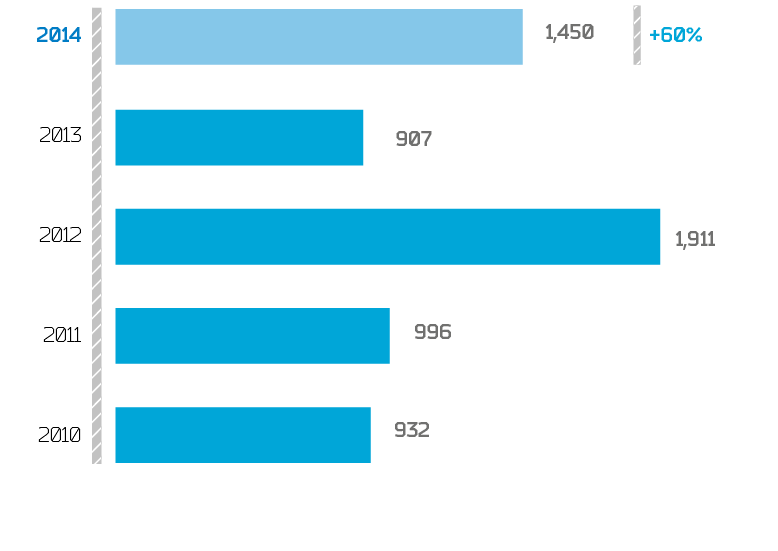
| Input of capacity | MVA | 932 | 996 | 1,911 | 907 | 1,450 | 59.9 |
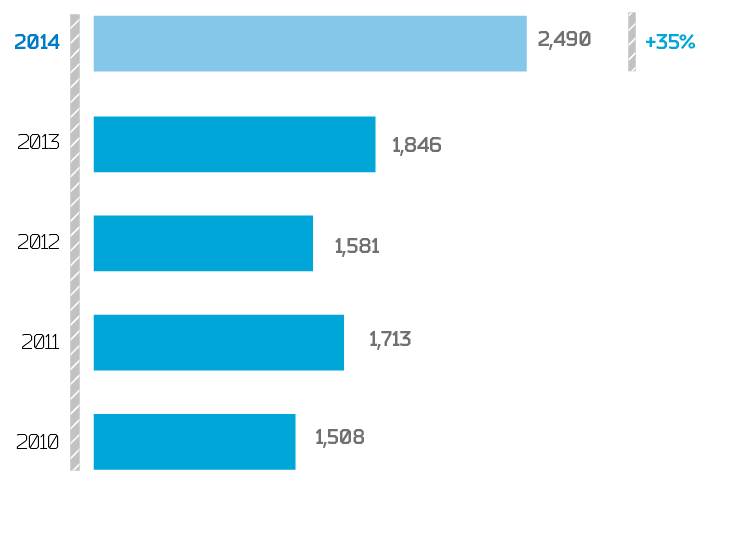
| Input of capacity | km | 1,508 | 1,713 | 1,581 | 1,846 | 2,490 | 34.8 |
| Indicators of a sustainable development | |||||||
| Average number of employees | people | 5,883 | 5,975 | 6,007 | 6,181 | 6,185 | 0.1 |
| Active turnover of personnel | % | 6.0 | 6.1 | 6.8 | 7.3 | 7.6 | 0.3 p.p. |
| Number of people trained | people | 2,692 | 2,827 | 2,732 | 3,126 | 2,940 | –6.0 |
| Expenses on training | RUB mln | 21 | 29 | 27 | 33 | 28 | –15.2 |
| Costs of labor protection | RUB mln | 92 | 88 | 98 | 109 | 106 | –2.8 |
| Costs of health protection of employees (VMI and accident insurance) | RUB mln | 84 | 84 | 89 | 79 | 87 | 9.1 |
| Environmental costs | RUB mln | 12 | 26 | 23 | 28 | 21 | –22.7 |
| Charitable expenses | RUB mln | 0 | 0 | 11 | 35 | 25 | –29.4 |
Indicators for