Annual report 2014
Since 1886
| Indicator | Supply to networks, mln kWh | Supply from networks to consumers and third-party TGOs within the borders of balance and operational responsibility, mln kWh | Losses | |
|---|---|---|---|---|
| mln kWh | % | |||
| St. Petersburg | 20,982 | 18,646 | 2,336 | 11.13 |
| Leningrad Region | 12,265 | 10,924 | 1,341 | 10.93 |
| Lenenergo, total | 33,248 | 29,570 | 3,677 | 11.06 |
In 2014 33,248 mln kWh of electric power were supplied to the Company grid from the networks of FGC UES and electricity producers. Lenenergo transmitted 29,570 mln kWh of electric power out of this amount to consumers and territorial network companies. Electricity losses accounted for 3,677 mln kWh, or 11.06% of total electric power supplied to Lenenergo networks.
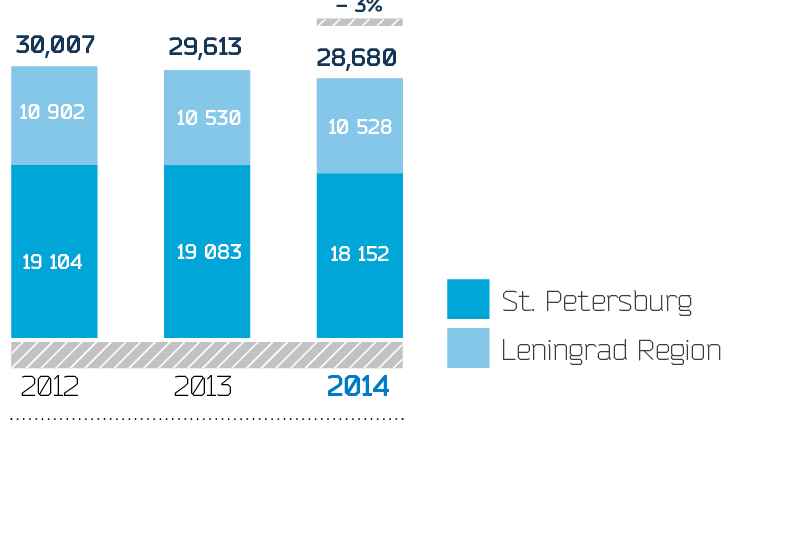
The volume of electricity transmission services (productive supply) decreased by 3.2%
This decrease is linked to the fact that in 2014 St. Petersburg and the Leningrad Region were excluded from the list of regions on the territory of which the so-called “last mile” mechanism continues to operate. There was a drop in the volume of Lenenergo services resulting from the conclusion by consumers connected to UNEG facilities of direct contracts with FGC UES.
In 2013, the volume of electricity transmission services rendered to these consumers amounted to 1,497.7 mln kWh. The leaving of these consumers was included in the tariff-balance decision for 2014 and has not resulted in lost income for Lenenergo.
The volume of rendered services on electricity transmission in 2014 increased by 487 mln kWh regarding 2013 under comparable conditions (including the so-called “last mile” consumers).
| Category | 2013 | 2014 | Change, % |
|---|---|---|---|
| Industrial consumers | 7,892 | 8,210 | 4.0 |
| Transport | 625 | 594 | –5.0 |
| Agriculture and food industry | 362 | 344 | –5.0 |
| Nonindustrial consumers | 4,762 | 4,644 | –2.5 |
| State (municipal) organizations and other budgetary consumers | 261 | 267 | 2.4 |
| Population and equivalent consumer categories | 6,150 | 5,921 | –3.7 |
| TGOs | 10,460 | 9,590 | –8.3 |
| Total | 30,513 | 29,570 | –3.1 |
In 2014, electricity consumption by industrial consumers grew driven by redistribution of some consumers between the groups of Industrial consumers and TGOs.
Decreased electricity consumption by other categories was the result of signing “direct contracts” by industrial consumers with FGC UES (1,420.3 mln kWh).
| Category | 2013 | 2014 | Change, % |
|---|---|---|---|
| HV | 8,046 | 7,461 | –7.3 |
| MV1 | 756 | 784 | 3.8 |
| MV2 | 11,099 | 10,890 | –1.9 |
| LV | 9,712 | 9,544 | –1.7 |
| Total | 29,613 | 28,680 | –3.2 |
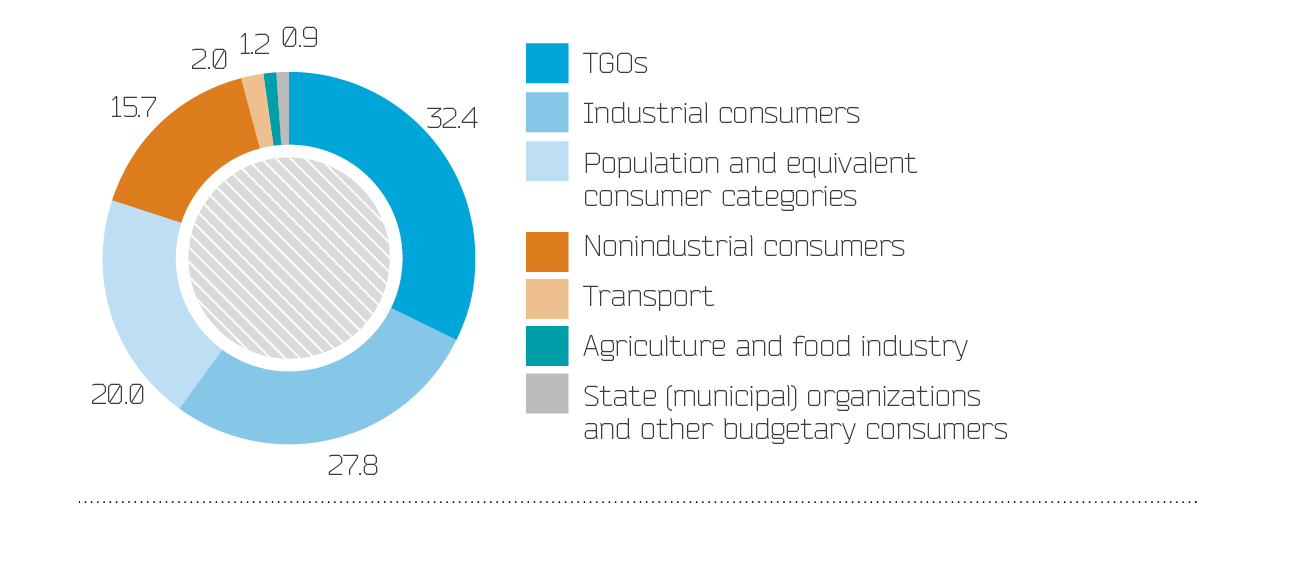
The largest share in the structure of electricity supply by groups of consumers is supply from Lenenergo networks to the networks of TGOs — 32.4% for Lenenergo, including 25.7% across St. Petersburg and 43.9% of total electricity consumption in the Leningrad Region. New TGOs are primarily formed on the basis of large enterprises (industrial sites) that transfer their own grid facilities in the use of TGOs.
In 2014, there was a drop in electricity consumption at the low voltage level primarily due to the lower consumption by the group “Population and equivalent consumer categories” and at the high voltage level due to the leaving of the “last mile” consumers.
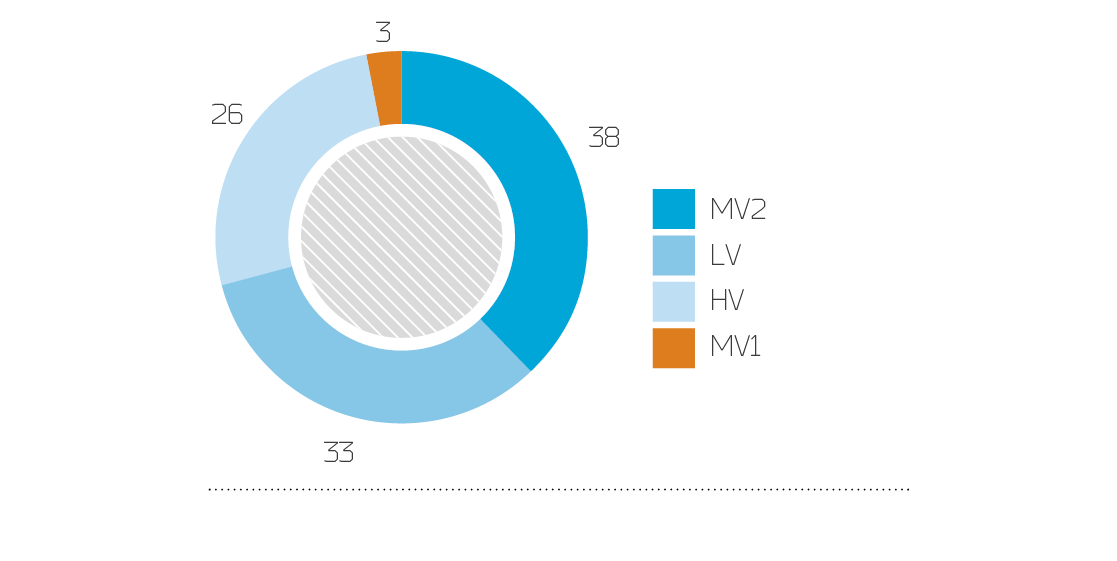
The structure of electricity supply by voltage levels is similar to the structure of electricity supply by groups of consumers: the main volume of services rendered to industrial consumers is rated at HV level, to non-industrial consumers — at MV2 level, and to the population — at LV level. The lowest amount of productive supply — 3%, is the share of MV1, as equipment
| Consumer | Consumption, Mln kWh | Share in the volume of services, % | |
|---|---|---|---|
| Productive electricity supply | 28,680 | 100 | |
| St. Petersburg | JSC PK Baltika | 29 | 0.10 |
| JSC Admiralty Shipyards | 69 | 0.24 | |
| JSC PK Energia | 84 | 0.29 | |
| JSC Svetlana | 65 | 0.23 | |
| JSC Shipbuilding Plant Severnaya Verf | 48 | 0.17 | |
| JSC MZ Arsenal | 23 | 0.08 | |
| Leningrad Region | LLC Cement | 166 | 0.58 |
| LLC PG Fosforit | 64 | 0.22 | |
| LLC BaltNefteProdukt | 160 | 0.56 | |
| FSUE Scientific Research Technological Institute (NITI) named after A.P. Aleksandrov | 46 | 0.16 | |
| JSC VLK | 205 | 0.71 | |
| CJSC Tikhvin Ferro-Alloy Plant | 268 | 0.93 | |
| JSC St. Petersburg Cardboard and Printing Plant | 143 | 0.50 | |
| Total for major consumers | 1,368 | 4.77 | |
Data on electricity consumption only by major industrial consumers of St. Petersburg and the Leningrad Region are specified in the table. Overall, the number of consumers with installed capacity of over 670 kW is more than 2,000 across the two regions.
| Indicator | 2012 | 2013 | 2014 | 2014 / 2013 | ||||
|---|---|---|---|---|---|---|---|---|
| mln kWh | % | mln kWh | % | mln kWh | % | % | p.p. | |
| St. Petersburg | 2,334 | 10.70 | 2,270 | 10.45 | 2,336 | 11.13 | 2.9 | 0.68 |
| Leningrad Region | 1,245 | 9.80 | 1,161 | 9.51 | 1,341 | 10.94 | 15.5 | 1.4 |
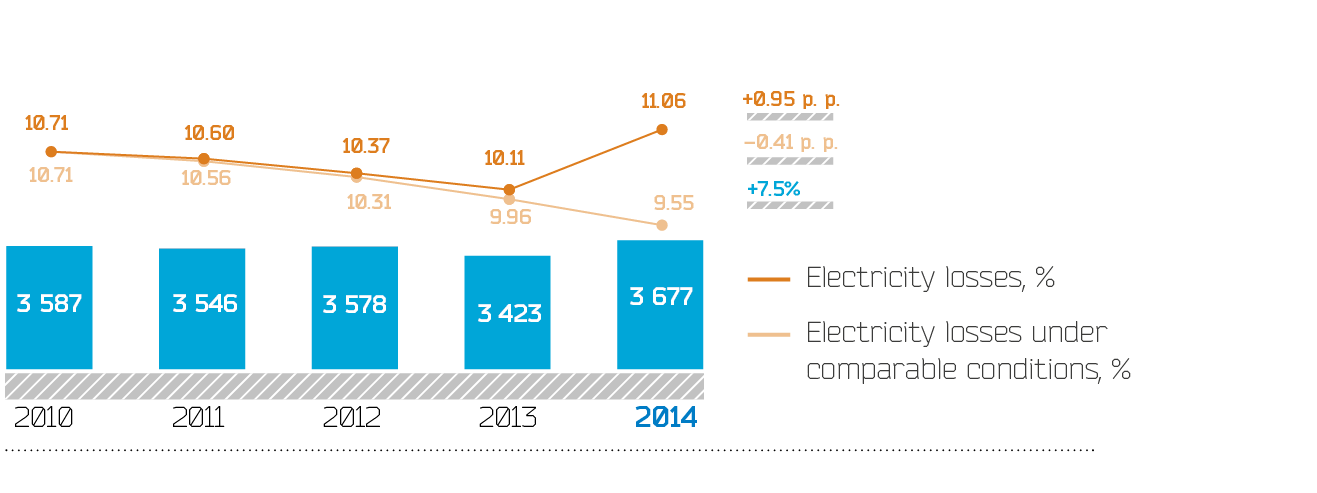
| Lenenergo, total | 3,578 | 10.37 | 3,431 | 10.11 | 3,678 | 11.06 | 7.2 | 0.95 |
In 2014, actual electricity losses in Lenenergo networks amounted to 3,678 mln kWh, or 11.06% of total supply to networks, and increased by 246 mln kWh, or 0.95 p.p.
| Indicator | 2012 | 2013 | 2014The analysis of changes in the relative amount of losses is provided considering the transition to definition of supply to the network in line with indications of AIMS CEM under comparable conditions. | 2014 / 2013 | ||||
|---|---|---|---|---|---|---|---|---|
| mln kWh | % | mln kWh | % | mln kWh | % | % | p.p. | |
| St. Petersburg | 2,334 | 10,70 | 2,270 | 10.45 | 2,103 | 9.61 | –7.4 | –0.84 |
| Leningrad Region | 1,245 | 9,80 | 1,161 | 9.51 | 1,222 | 9.45 | 5.3 | –0.05 |
| Lenenergo, total | 3,578 | 10.37 | 3,432 | 10.11 | 3,326 | 9.55 | –3.1 | –0.55 |
The growth of losses was driven by the change from 1 June 2014 of the method for determination of the amount of electricity supply from UNEG networks. Earlier, during formation of the actual balance of electricity on Lenenergo networks the amount of electricity received from UNEG networks in Lenenergo networks was formed by the approved calculation method. The application of this method was due to the lack of accounting system on the perimeter of FGC UES-Lenenergo. The calculation method principle consists in reduction of overflow volume of electricity that is defined by the metering devices (telemetry) installed on the upper borders of UNEG facilities on the high side from
Commissioning of AIMS CEM at the border of FGC UES-Lenenergo has entailed a sharp increase in electricity supply to Lenenergo networks. The increase in losses driven by the changes in the applied method for determining the size of electricity supply in cross section of Lenenergo-FGC UES amounts to 352 mln kWh. The amount of electricity losses in Lenenergo networks in 2014 under comparable conditions was 3,326 mln kWh (or 9.55% to supply in the network), which is 0.41 p.p. lower compared to the volume of losses under comparable conditions in 2013 (3,432 mln kWh, or 9.96 % to supply in the network).
Lenenergo conducts work on energy saving and increase of power efficiency in line with federal and local regulations, and pursuant to the Program of energy saving and increase of power efficiency of Lenenergo for
Objectives of the Program:
Introducing the power management system in Lenenergo
Improving the electricity transmission process: upgrade and construction of a new model of smart grid on the basis of innovative technologies and equipment, implementation of the systems for process control and network operation
Reducing losses by 2019 under comparable conditions by 21% from the level of 2013
Equipping by devices for electricity metering of commercial connections and transiting to automatic generation of the volume of services rendered in the full volume
Reducing energy consumption for utility and business needs by 15% and upgrade of the systems for water and heat supply of the buildings belonging to the Company
| Indicator | Unit | Plan | Fact |
|---|---|---|---|
| Electricity losses, including | mln kWh | 3,416 | 3,677 |
| % to fixed assets | 10.2 | 11.1 | |
| power for utility needs | mln kWh | 43 | 39 |
| Consumption for business needs, including by types of resources: | RUB mln | 200 | 192 |
| fuel and energy: | tons of equivalent fuel | 5,946 | 5,966 |
| RUB mln | 194 | 185 | |
| tons of equivalent fuel per m2 of the premises area | 0.10 | 0.06 | |
| electric power | mln kWh | 24 | 21 |
| RUB mln | 74 | 63 | |
| heat power | Gcal | 13,794 | 10,900 |
| RUB mln | 16 | 15 | |
| other (diesel fuel, kerosene, gasoline, etc.) | thous tons of equivalent fuel | 5,936 | 5,958 |
| RUB mln | 104 | 108 | |
| cold water supply | thous m³ | 276 | 273 |
| RUB mln | 6 | 6 | |
| Equipment by modern devices for electricity metering in the retail market | % | 15 | 9 |
Reasons for variation of the actual target for the indicator “Equipment by modern devices for electricity metering in the retail market” from the planed one are caused by shortage of electricity supply and counteraction from management companies and homeowner associations, and the emergency condition of electrical devices owned by consumers.
The Program of energy saving and increase of power efficiency consists of sections, target subprograms (activities) and accompanying measures which are subdivided into activities for decrease in losses during electricity transmission and distribution over electric networks and activities for decrease in energy consumption for production and business needs and are further subdivided into organizational and technical activities.
Target activities include those implementation of which ensures reduction of energy consumption (including electricity) and/or water for at least 15% of the annual consumption of the corresponding resource, with a payback of 80% of investments over five years for energy consumption and/or water used for production and business needs and a payback of no more than ten years for the activities ensuring decrease in losses during electricity transmission and distribution.
The activities which have positive power efficiency and are not corresponding to the criteria of reference to target activities are related to accompanying measures for optimization of consumption for production and business needs and measures for electricity losses reduction.
Identification of non-contractual consumption, switch-off of transformers in the modes of small loads at the substations with two and more transformers, switch-off of transformers at the substations with seasonal load, optimization of disconnection places with bilateral power supply, and alignment of phase loads in the distribution networks 0.38 kV are annually performed and related to the activities supporting the existing level of electricity losses and not affecting the indicators of the electricity balance of the Company.
| Activities | Annual effect of reducing losses due to the implemented activities, mln kWh |
|---|---|
| Organizational activities | 206 |
| Identification of non-metered consumption | 49 |
| Identification of non-contractual consumption | 157 |
| Technical activities | 22 |
| Switch off in the modes of small loads of transformers at substations with two and more transformers | 0.10 |
| Switch off of transformers at substations with seasonal load | 0.20 |
| Alignment of phase loads in electric networks | 0.50 |
| Decrease in electricity consumption for own needs of substations | 2.10 |
| Installation and commissioning of devices for compensation of reactive energy in electric networks | 0.01 |
| Replacement of wires by bigger section on overloaded OTL | 13.2 |
| Replacement of overloaded transformers | 5.80 |
| Replacement of branch lines with SIW in residential buildings | 0.03 |
| Load redistribution on the main network by switchings | 0.20 |
| Activities to improve electricity metering | 74 |
| Total | 302 |
In 2014, cumulative effect was expected in the amount of 195.7 mln kWh, or RUB 510.9 mln. By the end of 2014, the effect amounted to 302 mln kWh, or RUB 964.1 mln. The effect of activities supporting the existing level of losses amounted to 160.03 mln kWh, or RUB 219.9 mln.
The main target activities reducing consumption of resources for business needs are as follows: use of energy efficient lamps, replacement of mercury street lamps with led and sodium, replacement of windows with plastic or wooden ones with multi-chamber glazing, sealing of buildings, thermal insulation of flat roofs, and insulation of ceilings of the upper floors.
By the end of 2014, the effect of implementation of the target activities for decrease in energy consumption for business needs over the Company amounted to 5,966.5 thousand tons of equivalent fuel (273 mln liters of cold water) for RUB 185.4 mln at the plan of 5,946.1 thousand tons of equivalent fuel (276 mln liters of cold water) for RUB 193.8 mln.
The volume of identified non-metered consumption in 2014 amounted to 49,382 thousand kWh that is 29,746 thousand kWh above the level of 2013. The cost of the identified non-metered consumption in 2014 totaled RUB 150,310 thousand (including VAT).
The volume of identified non-contractual consumption in 2014 amounted to 351,527 thousand kWh, and compared to the fact of 2013 it decreased by 458,167 thousand kWh. The cost of the identified non-contractual consumption in 2014 totaled RUB 1,703,494 thousand (including VAT).
Normative and legal base regulating electricity transmission using RAB:
RAB (Regulatory Asset Base) is a system of long-term tariff formation aimed to attract investments in the expansion and modernization of infrastructure.
According to the Federal Law of 23 November 2009,
Pursuant to the Decree of the Government of the Russian Federation of 29 December 2011 #1178 (as amended by the Decree of the Government of the Russian Federation of 30 June 2012, #663) previously approved parameters of long-term tariff regulation were revised for Lenenergo, and the control period was extended until 2017 (Order of the Committee on tariffs of St. Petersburg of 13 July 2012,
When coordinating the tariff-balance decisions for 2014 with regional and federal executive authorities individual conditions of regulation on the growth of joint-operation tariffs for electricity transmission for 2014 were approved for Lenenergo at the level exceeding specified by the Government of the Russian Federation, as provided for in the forecast of social-economic development of the Russian Federation for 2014 across St. Petersburg and the Leningrad Region and is caused by execution of the large-scale investment programs.
| Indicator | St. Petersburg | Leningrad Region | Lenenergo, total |
|---|---|---|---|
| Invested capital (residual) as of 01.01.2014, RUB mln | 64,668 | 24,236 | 88,904 |
| CAPEX considered at tariff regulation, RUB mln | 87,247 | 23,915 | 111,162 |
| Rate of return on invested capital — old capital, % | |||
| 2011 | 6 | 6 | 6 |
| 1 | 1 | 1 | |
| 2017 | 11 | 11 | 11 |
| Rate of return on invested capital — new capital, % | |||
| 2011 | 12 | 12 | 12 |
| 2012 | 12 | 12 | 12 |
| 2013 and further | 11 | 11 | 11 |
| Term of return on investment capital, years | 35 | 35 | 35 |
Tariffs for electricity transmission services were approved for 2012 within the levels coordinated by the Federal Tariff Service under the joint-operation principle that is uniform for the entire subject of the Russian Federation.
Since 2008, single (joint-operation) tariffs for electricity transmission services have been approved for all consumers, irrespective of the point of connection to urban networks in the region (item 42 of the Rules of non-discriminatory access to electricity transmission services and rendering of these services of 27 December 2004, #861), and individual tariffs for electricity transmission for calculations between network companies.
Tariffs for electricity transmission across the Leningrad Region were approved under the scheme «cost plus». According to this scheme, all payments collected by sales companies arrive in the higher territorial grid organization of Lenenergo which pays off with the subordinate territorial grid companies.
Tariffs for electricity transmission across St. Petersburg were approved under the scheme «mixed cost». According to this scheme, all payments collected by sales companies arrive in the higher territorial grid organization of Lenenergo which pays off with all subordinate territorial grid companies, except CJSC KirovTEK. An individual double-rate tariff under the principle “cost minus” was set for CJSC KirovTEK (this company pay Lenenergo for electricity transmission services).
Besides Lenenergo, electricity transmission activities are performed by 19 territorial grid organizations in St. Petersburg and 31 organizations in the Leningrad Region.
| Indicator | Unit | 2012 | 2013 | 2014 | |||
|---|---|---|---|---|---|---|---|
| 1st half | 2nd half | 1st half | 2nd half | 1st half | 2nd half | ||
| St. Petersburg | |||||||
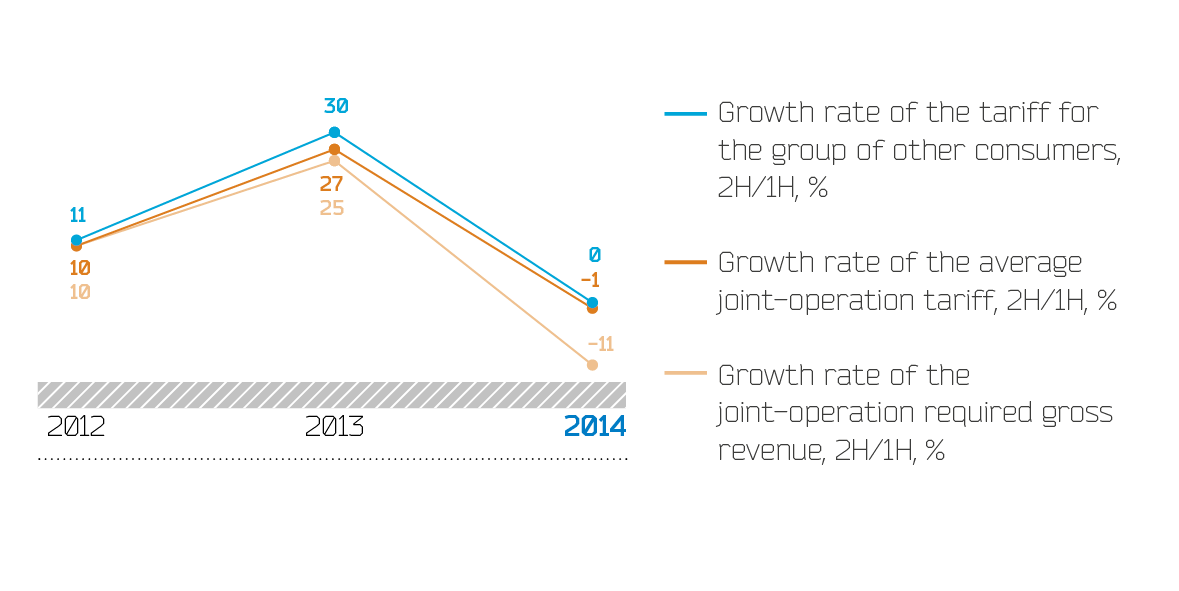
| Joint-operation required gross revenue | RUB mln | 9,070 | 9,984 | 10,139 | 12,713 | 13,970 | 12,456 |
| Growth rate of the joint-operation required gross revenue, 2H/1H | % | 10 | 25 | — 11 | |||
| Average joint-operation tariff | kop/kWh | 94 | 103 | 104 | 131 | 142 | 141 |
| Growth rate of the average joint-operation tariff, 2H/1H | % | 10 | 27 | — 1 | |||
| Tariff for the group “Other consumers” | kop/kWh | 107 | 119 | 118 | 153 | 168 | 168 |
| Growth rate of the tariff for the group “Other consumers”, 2H/1H | % | 11 | 30 | 0 | |||
| Leningrad Region | |||||||
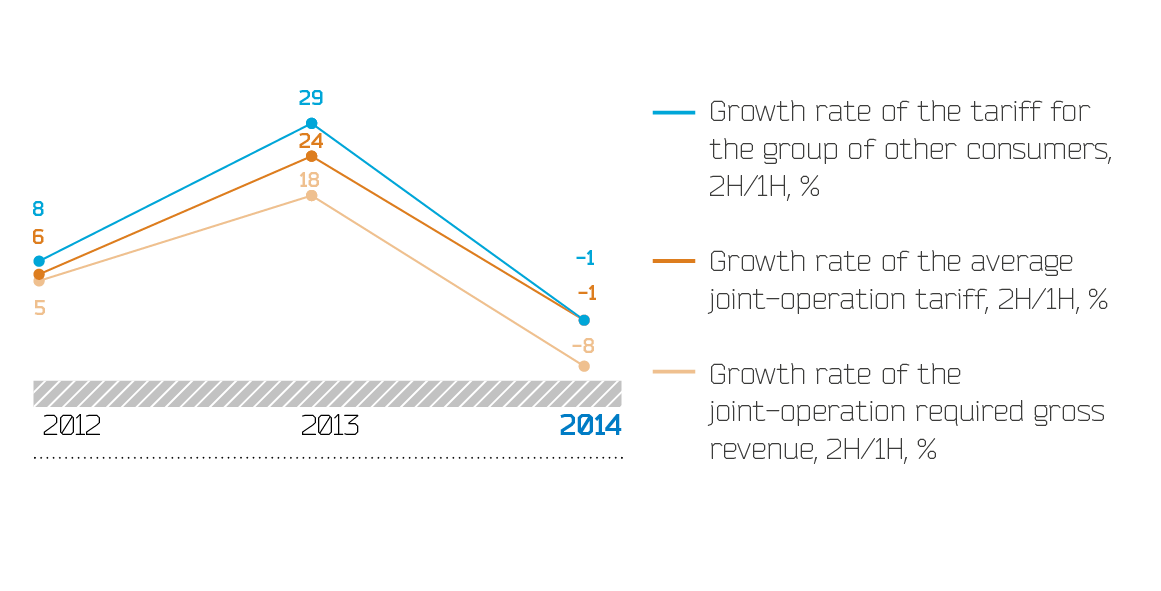
| Joint-operation required gross revenue | RUB mln | 6,308 | 6,645 | 6,493 | 7,693 | 8,360 | 7,710 |
| Growth rate of the joint-operation required gross revenue, 2H/1H | % | 5 | 18 | — 8 | |||
| Average joint-operation tariff | kop/kWh | 114 | 121 | 103 | 127 | 132 | 131 |
| Growth rate of the average joint-operation tariff, 2H/1H | % | 6 | 24 | — 1 | |||
| Tariff for the group “Other consumers” | kop/kWh | 109 | 117 | 108 | 140 | 141 | 141 |
| Growth rate of the tariff for the group “Other consumers”, 2H/1H | % | 8 | 29 | — 1 | |||
| Lenenergo, total | |||||||
| Joint-operation required gross revenue | RUB mln | 15,378 | 16,629 | 16,633 | 20,406 | 22,330 | 20,165 |
| Growth rate of the joint-operation required gross revenue, 2H/1H | % | 8 | 23 | — 10 | |||
| Average joint-operation tariff | kop/kWh | 101 | 110 | 103 | 130 | 138 | 137 |
| Growth rate of the average joint-operation tariff, 2H/1H | % | 8 | 26 | — 1 | |||
| Tariff for the group “Other consumers” | kop/kWh | 108 | 118 | 114 | 148 | 157 | 156 |
| Growth rate of the tariff for the group “Other consumers”, 2H/1H | % | 10 | 30 | — 1 | |||
The average transmission tariff in the second half of the year is calculated as the ratio of required gross revenue in the second half of each year to the amount of productive supply on the relevant groups of consumers, including other consumers.
Other consumers is a group of consumers who, in accordance with the Guidelines on calculation of regulated tariffs and prices for electric (heat) power in the retail (consumer) market approved by Order of the Federal Tariff Service of 6 August 2004, #20-e/2, are not included in the basic group of consumers under which the maximum value of customer contract demand is equal to (or more than) 20 MW, and its use per year is more than 7,500 hours (group 1) and the population and equivalent consumer categories (group 2).
Absence of the excess level of electricity transmission tariffs in the second half relative to the first half of 2014 was due to implementation by the regulators of St. Petersburg and the Leningrad Region of the Resolution of the Government of the Russian Federation of 11 June 2014, #542 “About amendments to certain acts of the Government of the Russian Federation regarding compensation to network organizations of the lost income related to technological connection to electric networks, and adoption of tariff decisions”.
Detailed information about electricity transmission tariffs in the regions of the Company’s presence set for
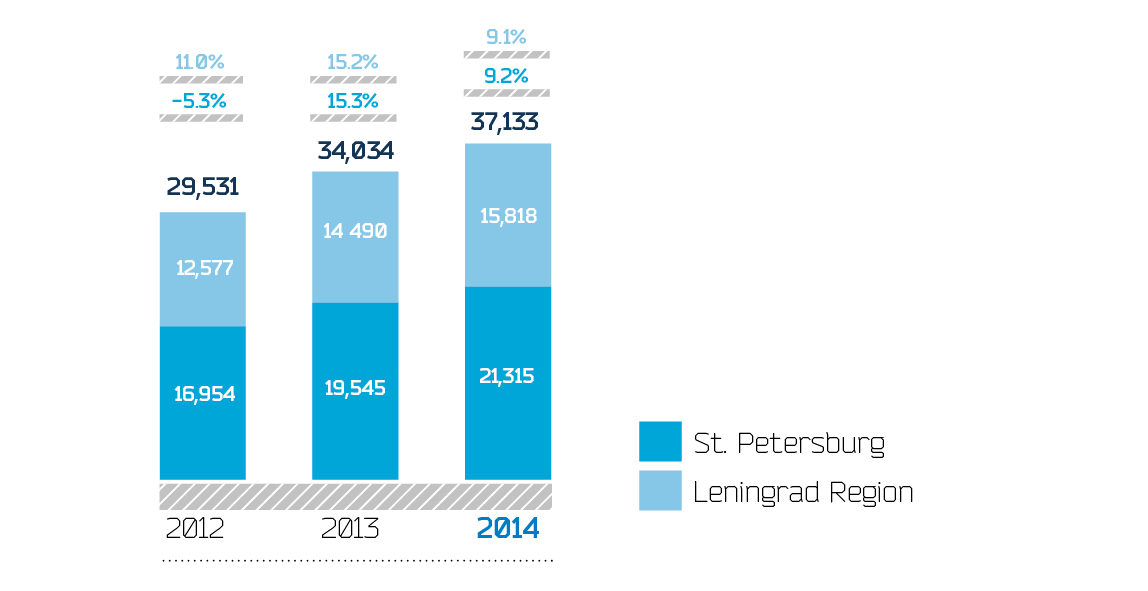
The amount of actual revenue from electricity transmission services excluding reduction on the value of loading losses in 2014 totaled RUB 37,133 mln, up by RUB 3,099 compared to 2013.
| Indicator | 2012 | 2013 | 2014 | |||
|---|---|---|---|---|---|---|
| Total | Company’s | Total | Company’s | Total | Company’s | |
| St. Petersburg | 19,050 | 7,273 | 22,852 | 9,096 | 26,425 | 12,348 |
| Leningrad Region | 12,953 | 3,657 | 14,130 | 5,896 | 16,070 | 5,191 |
| Lenenergo, total | 32,003 | 10,930 | 36,982 | 14,992 | 42,495 | 17,539 |
| Indicator | Unit | 2012 | 2013 | 2014 | 2014 (fact) / 2014 (approved), % | 2014 (fact) / 2013 (fact), % | |
|---|---|---|---|---|---|---|---|
| Fact | Fact | Approved by REC | Fact | ||||
| Leningrad Region | |||||||
| Revenue1 | RUB mln | 12,577 | 14,490 | 16,070 | 15,818 | — 1.6 | 9.2 |
| Productive electricity supply | mln kWh | 10,902 | 10,530 | 10,492 | 10,528 | 0.3 | — 0.02 |
| Average tariff | kop/kWh | 115.4 | 137.6 | 153.2 | 150.3 | — 1.9 | 9.2 |
| Growth rate of average tariff | % | 6 | 19 | 11 | — 2 | ||
| St. Petersburg | |||||||
| Revenue1 | RUB mln | 16,954 | 19,545 | 26,425 | 21,315 | — 19.3 | 9.1 |
| Productive electricity supply | mln kWh | 19,104 | 19,083 | 18,676 | 18,152 | — 2.8 | — 4.9 |
| Average tariff | kop/kWh | 88.7 | 102.4 | 141.5 | 117.4 | — 17.0 | 14.6 |
| Growth rate of average tariff | % | — 8 | 15 | 38 | — 17 | ||
| Lenenergo, total | |||||||
| W/o reduction on the value of loading losses.Revenue | RUB mln | 29,531 | 34,034 | 42,495 | 37,133 | — 12.6 | 9.1 |
| Productive electricity supply | mln kWh | 30,007 | 29,613 | 29,168 | 28,680 | — 1.7 | — 3.2 |
| Average tariff | kop/kWh | 98.4 | 114.9 | 145.7 | 129.5 | — 11.1 | 12.7 |
| Growth rate of average tariff | % | — 2.5 | 16.8 | 26.8 | — 88.9 | ||
Decrease in actual revenue from electricity transmission concerning the revenue approved on the both regions of the Russian Federation amounted to RUB 5,363 mln driven by the following factors:
The reasons for variation of actual revenue from the revenue considered in the tariff-balance decision are as follows:
| Indicator | 2012 | 2013 | 2014 | 2014/2013, % |
|---|---|---|---|---|
| St. Petersburg | ||||
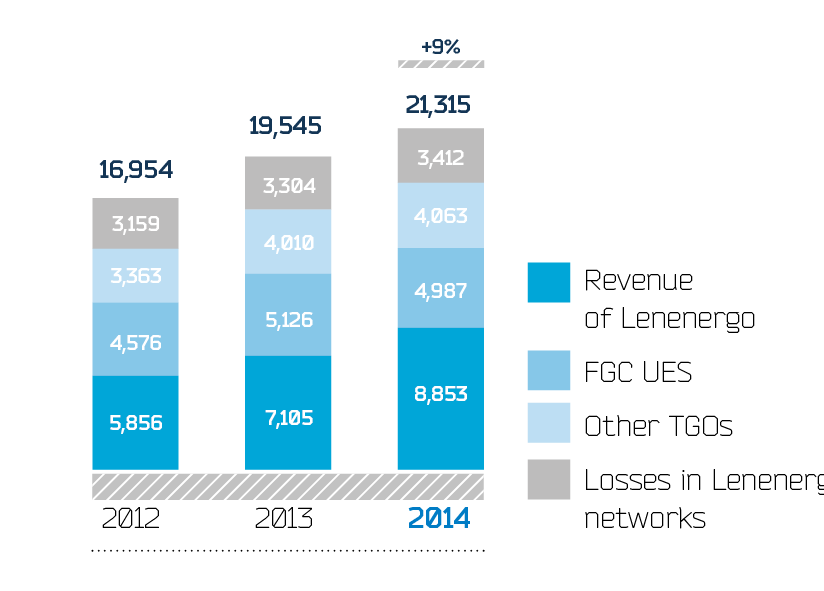
| Revenue, total | 16,954 | 19,545 | 21,315 | 9 |
| Own revenue of Lenenergo | 5,856 | 7,105 | 8,853 | 25 |
| FGC UES | 4,576 | 5,126 | 4,987 | — 3 |
| Other TGOs | 3,363 | 4,010 | 4,063 | 1 |
| Losses in Lenenergo networks | 3,159 | 3,304 | 3,412 | 3 |
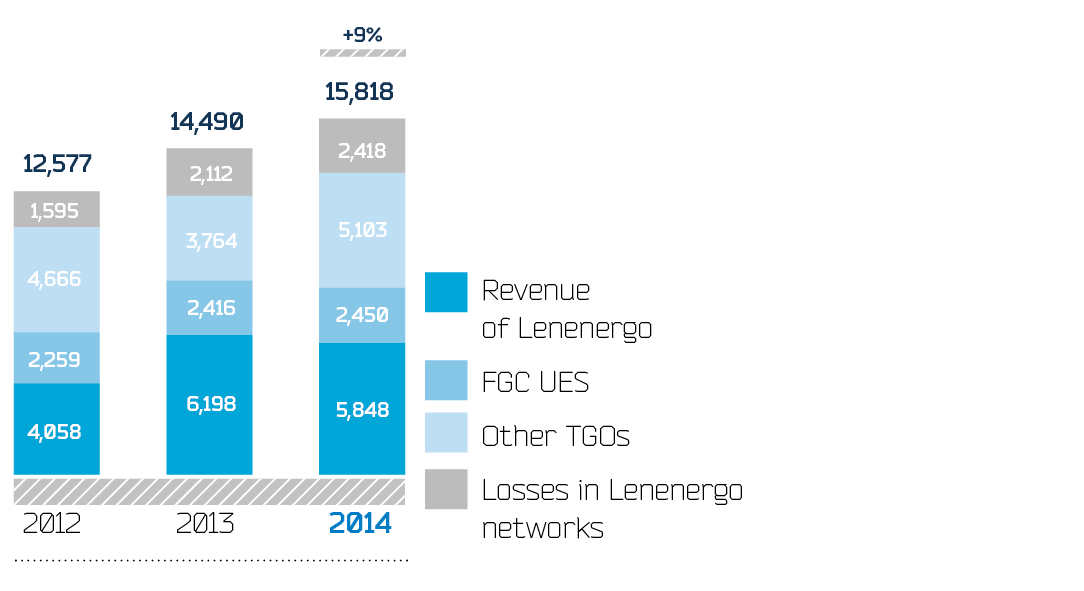
| Leningrad Region | ||||
| Revenue, total | 12,577 | 14,490 | 15,818 | 9 |
| Own revenue of Lenenergo | 4,058 | 6,198 | 5,848 | — 6 |
| FGC UES | 2,259 | 2,416 | 2,450 | 1 |
| Other TGOs | 4,666 | 3,764 | 5,103 | 36 |
| Losses in Lenenergo networks | 1,595 | 2,112 | 2,418 | 15 |
| Lenenergo, total | ||||
| Revenue, total | 29,531 | 34,034 | 37,133 | 9 |
| Growth rate, % | 1 | 15 | 9 | |
| Own revenue of Lenenergo | 9,914 | 13,303 | 14,700 | 11 |
| Growth rate, % | 4 | 34 | 11 | |
| FGC UES | 6,834 | 7,542 | 7,437 | — 1 |
| Growth rate, % | 7 | 10 | — 1 | |
| Other TGOs | 8,029 | 7,774 | 9,166 | 18 |
| Growth rate, % | 1 | — 3 | 18 | |
| Losses | 4,754 | 5,415 | 5,829 | 8 |
| Growth rate, % | — 11 | 14 | 8 |
| Indicator | St. Petersburg | Leningrad Region | Lenenergo, total |
|---|---|---|---|
| Other consumers | 11 | 353 | 364 |
| Third-party network organizations | 135 | — | 135 |
| Power supply organization | 817 | 2,346 | 3,163 |
| Guaranteeing supplier | 19,808 | 12,791 | 32,599 |
| Total | 20,771 | 15,490 | 36,261 |
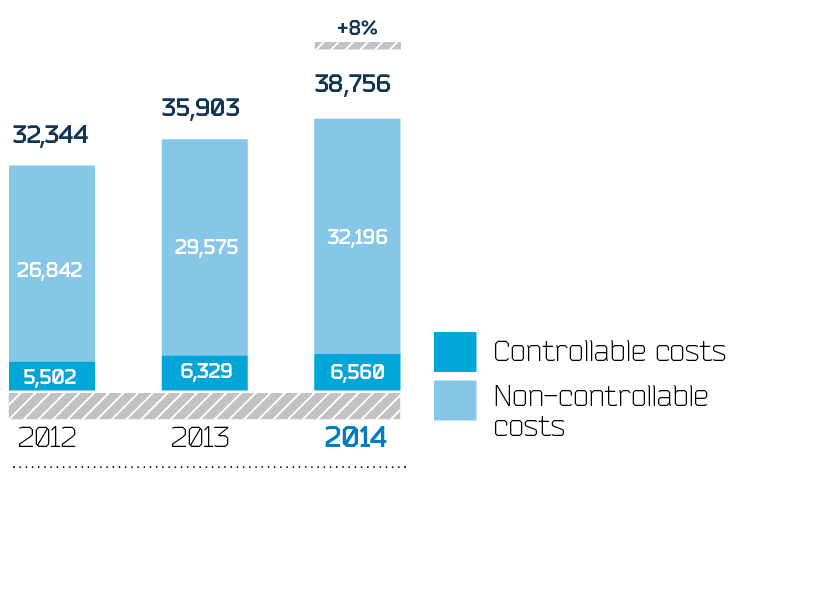
The cost of electricity transmission services in 2014 totaled RUB 38,756 mln and increased by RUB 2,853 mln, or 7.9%
| Indicator | Indicators for 2012 and 2013 are given according to the annual accounting statements for 2014 including retrospective data.2012 | Indicators for 2012 and 2013 are given according to the annual accounting statements for 2014 including retrospective data.2013 | 2014 | 2014 / 2013, % |
|---|---|---|---|---|
| Controllable costs | 5,502 | 6,329 | 6,560 | 3.7 |
| Raw materials and supplies | 464 | 497 | 517 | 3.8 |
| Works and services of production character | 1,121 | 1,367 | 1,283 | — 6.2 |
| Payroll | 2,596 | 2,939 | 3,153 | 7.3 |
| Other costs | 1,321 | 1,525 | 1,608 | 5.5 |
| Non-controllable costs | 26,842 | 29,575 | 32,196 | 8.9 |
| Purchased power to compensate for losses | 4,754 | 5,415 | 5,829 | 7.6 |
| Services in electric power transmission by networks of third-party regional grid companies | 8,029 | 7,774 | 9,166 | 17.9 |
| FGC UES fee | 6,119 | 6,715 | 6,566 | — 2.2 |
| Depreciation of fixed assets and intangible assets | 6,270 | 8,254 | 8,967 | 8.6 |
| Lease payments | 803 | 123 | 76 | — 38.5 |
| Other costs | 867 | 1,294 | 1,592 | 23.1 |
| Total costs | 32,344 | 35,903 | 38,756 | 7.9 |
Compared to 2013 the changes are as follows:
Controllable costs were up by RUB 231 mln, or 3.7%
Non-controllable costs were up by RUB 2,622 mln, or 8.9%
| Indicator | Indicators for 2012 and 2013 are given according to the annual accounting statements for 2014 including retrospective data2012 | Indicators for 2012 and 2013 are given according to the annual accounting statements for 2014 including retrospective data2013 | 2014 | 2014 / 2013, % |
|---|---|---|---|---|
| Revenue from electricity transmission on networks | 28,816 | 33,207 | 36,261 | 9.2 |
| Cost of electricity transmission on networks | 32,344 | 35,903 | 38,756 | 7.9 |
| Gross profit from electricity transmission on networks | — 3,529 | — 2,696 | — 2,495 | 7.5 |
| Interest payable | 1,788 | 2,217 | 2,766 | 24.8 |
| Other expenses | 830 | 887 | 4,464 | 403.4 |
| Profit (loss) before tax from electricity transmission on networks | — 6,146 | — 5,800 | — 9,725 | 67.7 |
| Profit tax attributable to transmission activities | 427 | 646 | 884 | 36.9 |
| Net profit (loss) from electricity transmission on networks | — 6,573 | — 6,446 | — 10,609 | — 64.6 |
Since 2011, the Company has completed the transition to RAB-regulation. The loss from electricity transmission in 2012 amounted to RUB 6,573 mln, in 2013 — RUB 6,446 mln, and in 2014 — RUB 10,609 mln.
The occurrence of losses from electricity transmission activities was influenced by the following factors:
In 2014, losses from electricity transmission increased by RUB 4,163 mln compared to 2013. The increase of losses was primarily caused by the growth of other costs attributable to transmission activities at the expense of reflection of provisions for disagreements with third-party grid organizations, write-offs of losses on the lost cases on disagreements with third-party grid organizations, increase in the amount of interest payable and profit tax.
| Indicator | Indicators for 2012 and 2013 are given according to the annual accounting statements for 2014 including retrospective data2012 | Indicators for 2012 and 2013 are given according to the annual accounting statements for 2014 including retrospective data2013 | 2014 | 2014/2013, % |
|---|---|---|---|---|
| Net profit (loss) from electricity transmission | — 6,573 | — 6,446 | — 10,609 | 64.6 |

2 Indicators for 2012 and 2013 are given according to the annual accounting statements for 2014 including retrospective data
| Indicator | St. Petersburg | Leningrad region | Lenenergo, total |
|---|---|---|---|
| Equity funds for investments and expenses from profit | 6,800 | 367 | 9,867 |
| Expenses from profit (interest on loans, social payments, dividends, other expenses) | 2,821 | 1,558 | 4,379 |
| Depreciation | 6,091 | 3,191 | 9,282 |
| Equity funds for investments (item 1 — item 2 — item 3) | — 2,112 | — 1,682 | — 3,794 |
| Smoothing | — 1,102 | — 919 | — 2,021 |
| Lost income | 2,284 | — 235 | 2,049 |
| Total loss on electricity transmission approved by regulators | — 930 | — 2,836 | — 3,766 |
In accordance with the approved tariffs for 2014, the Company forms losses from electricity transmission activities in the amount of RUB 3,767 mln. In 2014, the actual loss from electricity transmission activities totaled RUB 10,609 mln, which is RUB 6,843 mln, or 181.7%
| Indicator | St. Petersburg | Leningrad region | Lenenergo, total |
|---|---|---|---|
| Revenue | — 5,111 | — 252 | — 5,363 |
| Controllable costs | — 49 | 462 | 413 |
| Non-controllable costs | — 1,465 | — 887 | — 2,352 |
| Profit tax | 505 | 380 | 884 |
| Expenses from profit | 2,418 | 433 | 2,850 |
| Depreciation | — 525 | 210 | — 315 |
| Total growth of loss | — 5,994 | — 848 | — 6,843 |
Reasons for variation of actual indicators from the indicators approved at regulation:
The decrease in sales revenue from the revenue considered by regulators amounted to RUB 5,363 mln. Key driver were as follows: application by the Committee on tariffs of St. Petersburg in calculations of tariff rates of the overestimated customer contract demand, variation of the actual structure of consumers by groups and voltage levels from the structure considered by the committees at formation of the balance of electric power and capacity, change of the actual productive electricity supply relative to that considered by the committees and its redistribution by half-year periods of 2014.
The growth of controllable costs in comparison with the costs considered by regulators amounted to RUB 413 mln. The greatest influence was rendered by increased repair expenses on the additional activities held to ensure reliable power supply of consumers (in preliminary coordination with regulators), rising labor costs due to the activities undertaken to motivate employees of key positions and professions, and changes in the legislation on payment of remuneration to the staff engaged in work with harmful working conditions.
The drop of non-controllable costs was RUB 2,352 mln. The main influence was rendered by:
The growth of profit tax amounted to RUB 884 mln. Variation for the profit tax was linked to different methods of calculating profit tax. The regulator does not consider the features of tax accounting.
The growth of expenses from profit amounted to RUB 2,850 mln. The greatest influence was rendered by creation of provisions for disagreements with third-party grid organizations, and write-off of losses on the lost cases on disagreements with third-party grid organizations.
Depreciation in 2014 was RUB 315 mln below the depreciation considered by the regulator, which is due to the reduction in the average rate of depreciation as a result of changes in the structure by groups of fixed assets.