Annual report 2014
Since 1886
Indicators for 2012 and 2013 are given herein according to the annual accounting statements for 2014 including retrospective data.
| Indicator | 2012 | 2013 | 2014 | 2014 / 2013, % |
|---|---|---|---|---|
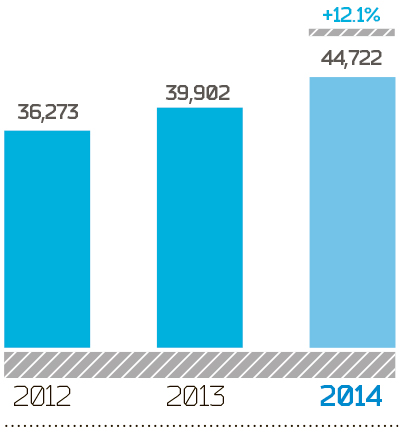
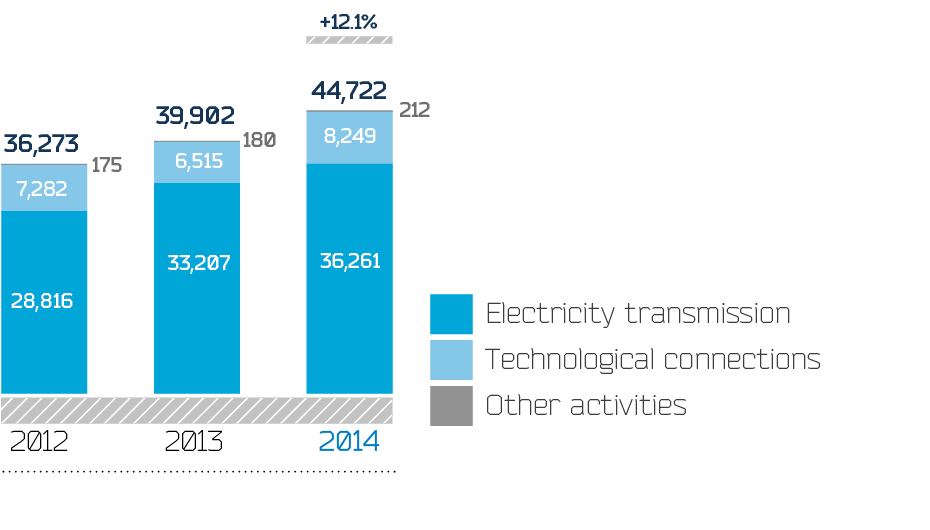
| Revenue from products (services), including: | 36,273 | 39,902 | 44,722 | 12.1 |
| from electric power transmission | 28,816 | 33,207 | 36,261 | 9.2 |
| from technological connections | 7,282 | 6,515 | 8,249 | 26.6 |
| from other activities | 175 | 180 | 212 | 17.8 |
| Cost of products (services) | — 32,830 | — 36,429 | — 39,257 | 7.8 |
| Gross profit | 3,443 | 3,473 | 5,466 | 57.4 |
| Interest receivable | 296 | 644 | 1,345 | 108.9 |
| Interest payable | — 1,788 | — 2,217 | — 2,766 | 24.8 |
| Income from participation in other organizations | 1 | 1 | 1 | 0.0 |
| Other income, total | 1,924 | 3,529 | 3,623 | 2.7 |
| Other expenses, total | — 1,914 | — 3,985 | — 16,461 | 313.1 |
| Profit (loss) before tax | 1,962 | 1,444 | — 8,793 | - |
| Profit tax and other payments | — 920 | — 1,019 | 826 | - |
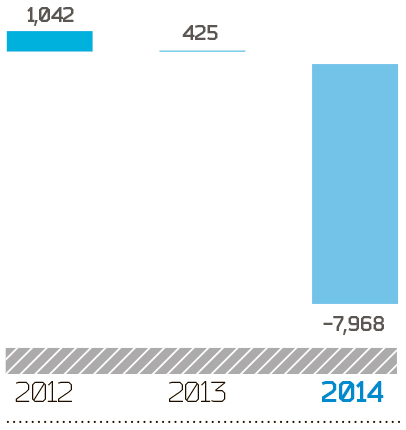
| Net profit (loss) | 1,042 | 425 | — 7,968 | - |
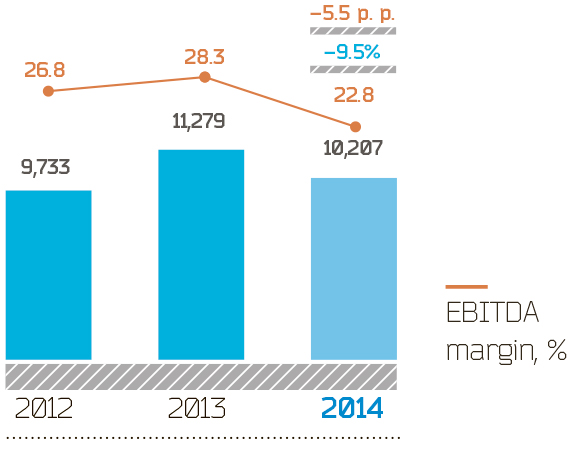
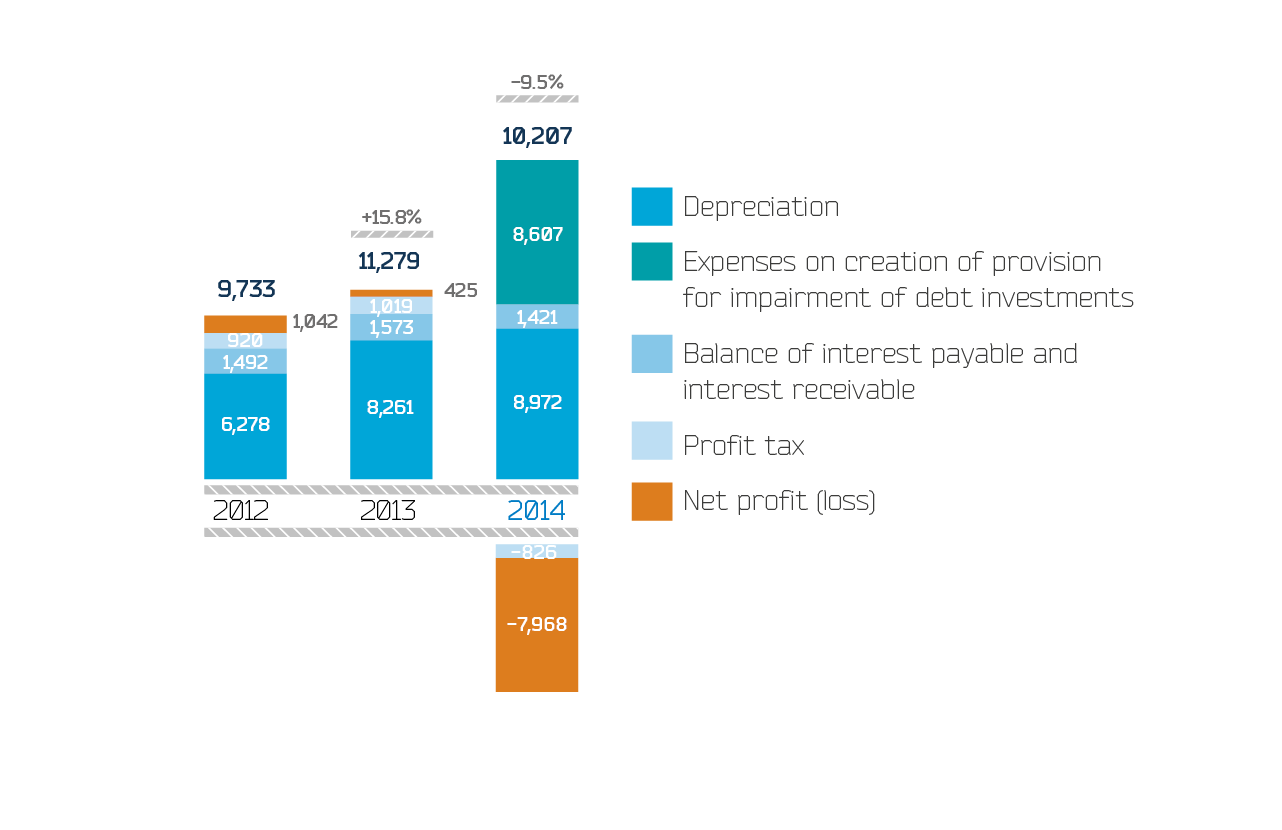
| EBITDA is calculated as: EBITDA = Net profit + Profit tax + Depreciation + Interest payable — Interest receivable + Provision for impairment of debt investments.EBITDA | 9,733 | 11,279 | 10,207 | — 9.5 |
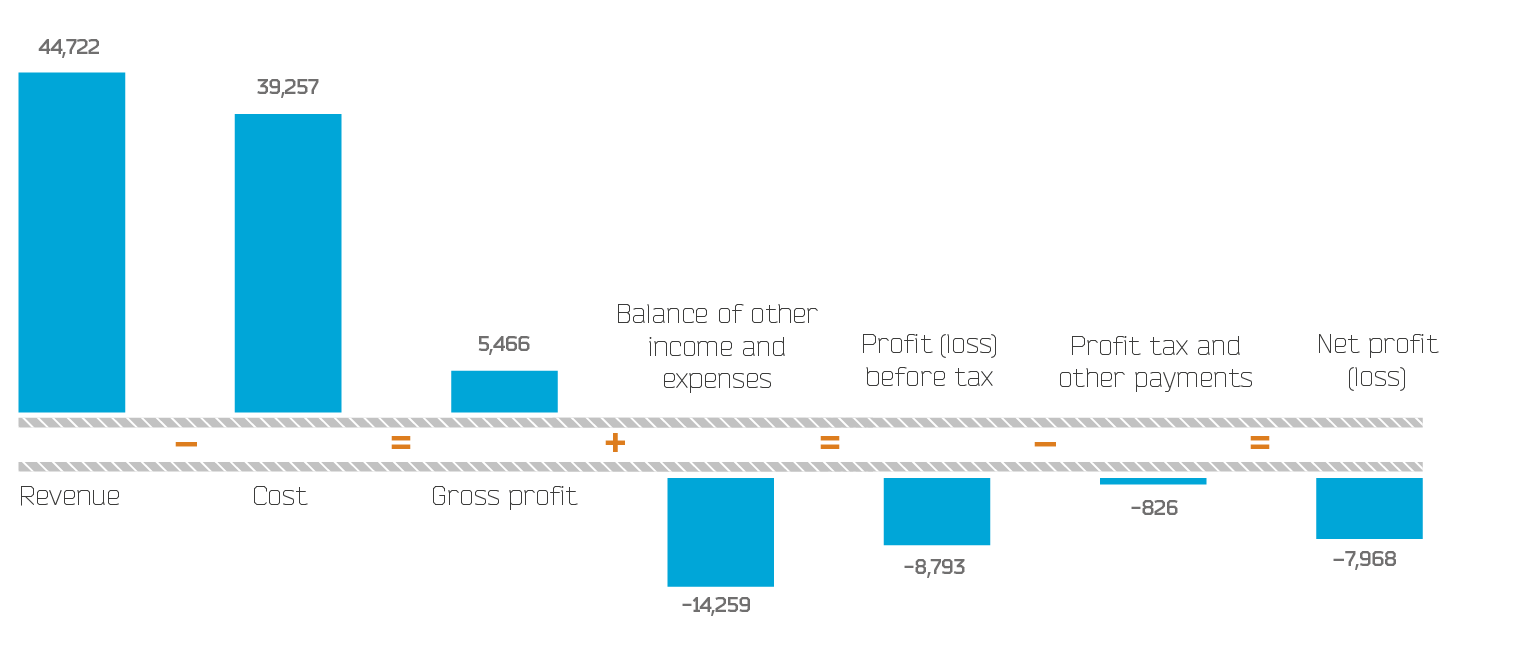
Revenue from products (services) in 2014 increased by RUB 4,820 mln, or 12.1%
Cost increased by RUB 2,827 mln, or 7.8%
Thus, gross profit for the reporting period grew by RUB 1,993 mln compared to 2013 to RUB 5,466 mln.
Profit before tax dropped by RUB 10,238 mln compared to 2013 totaling RUB 8,793 mln.
By the end of 2014 net loss of the Company amounted to RUB 7,968 mln (i.e. financial result was RUB 8,393 mln below the level of 2013). The decrease in net profit in 2014 was mainly due to the growth of negative balance of other income and expenses, resulting from creation of provision for impairment of investments in connection with the problems of Bank Tavrichesky, increase of expenses on creation of provision for disagreements with third-party grid organizations and reflection of losses for lost cases involving disagreements with third-party grid organizations.
| Indicator | 2012 | 2013 | 2014 | 2014 / 2013, % | |||
|---|---|---|---|---|---|---|---|
| RUB mln | % | RUB mln | % | RUB mln | % | ||
| Sales revenue | 36,273 | 100.0 | 39,902 | 100.0 | 44,722 | 100.0 | 12.1 |
| Electricity transmission | 28,816 | 79.4 | 33,207 | 83.2 | 36,261 | 81.1 | 9.2 |
| Technological connections | 7,282 | 20.1 | 6,515 | 16.3 | 8,249 | 18.4 | 26.6 |
| Other products (services) of core activities | 175 | 0.5 | 180 | 0.5 | 212 | 0.5 | 17.8 |
In 2014, sales revenue increased by RUB 4,820 mln, or 12.1%
Income from electricity transmission services account for a major share in the revenue structure of Lenenergo. At year-end, this type of revenue accounted for 81.1%, or RUB 36,261 mln (up by 9.2%
Income from technological connection services in 2014 increased by 26.6%
Other income generated RUB 212 mln for the Company, accounting for 0.5% of total revenue (up by 17.6%
| Indicator | 2012 | 2013 | 2014 | 2014 / 2013, % | |||
|---|---|---|---|---|---|---|---|
| RUB mln | % | RUB mln | % | RUB mln | % | ||
| The cost structure includes administrative and commercial expenses.Cost of products (services) | 32,830 | 100.0 | 36,429 | 100.0 | 39,257 | 100.0 | 7.8 |
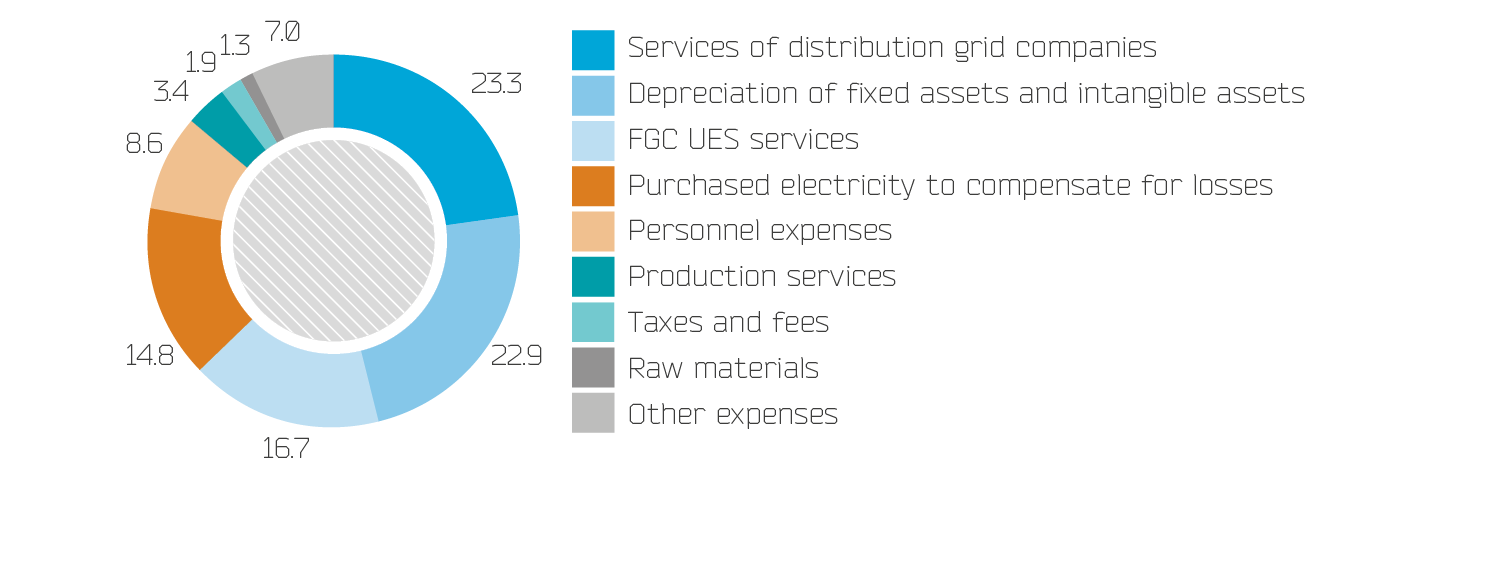
| Depreciation of fixed assets and intangible assets | 6,278 | 19.1 | 8,261 | 22.7 | 8,972 | 22.9 | 8.6 |
| Purchased electricity to compensate for losses | 4,754 | 14.5 | 5,415 | 14.9 | 5,829 | 14.8 | 7.6 |
| FGC UES services | 6,119 | 18.6 | 6,715 | 18.4 | 6,566 | 16.7 | — 2.2 |
| Services of distribution grid companies | 8,029 | 24.5 | 7,774 | 21.3 | 9,166 | 23.3 | 17.9 |
| Raw materials | 463 | 1.4 | 497 | 1.4 | 515 | 1.3 | 3.6 |
| Production services | 1,208 | 3.7 | 1,454 | 4.0 | 1,341 | 3.4 | — 7.8 |
| Personnel expenses | 2,790 | 8.5 | 3,154 | 8.7 | 3,384 | 8.6 | 7.3 |
| Taxes and fees | 135 | 0.4 | 500 | 1.4 | 745 | 1.9 | 49.0 |
| Other expenses | 3,054 | 9.3 | 2,659 | 7.3 | 2,739 | 7.0 | 3.0 |
Expenses for purchased electricity to compensate for losses in 2014 amounted to RUB 5,829 mln, accounting for 14.8% of total expenses. In absolute terms, the growth amounted to RUB 414 mln, or 7.6 %
Expenses for FGC UES services amounted to RUB 6,566 mln, or 16.7% of total expenses. The decline compared to 2013 in absolute terms totaled RUB 149 mln and was mainly due to the reduction of customer contract demand by 363 MW, or 9.3%
Expenses for electricity transmission services of third-party grid organizations in 2014 amounted to RUB 9,166 mln, or 23.3% of total expenses. The growth of expenses totaled RUB 1,392 mln compared to 2013. The increase was due to the indexation of individual tariffs from the second half of 2014.
Personnel expenses in 2014 amounted to RUB 3,384 mln, accounting for 8.6% of total expenses, up by 7.3%
Depreciation of fixed assets and intangible assets was up by RUB 711 mln compared to 2013 due to the increased book value of assets as a result of execution of the investment program on commissioning of fixed assets.
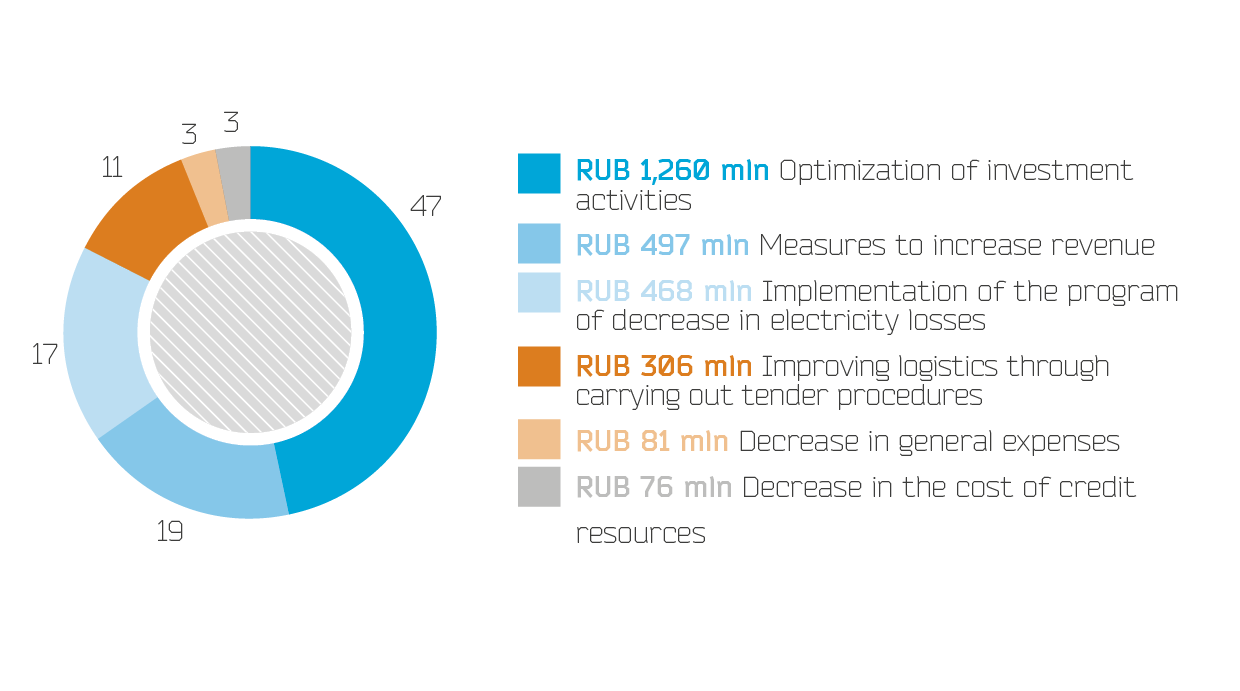
Devised and run in 2014, the cost management program of Lenenergo which includes a complex of organizational and technical measures aims to improve the Company’s performance, namely: measures to increase revenue, improving logistics through tender procedures, optimization of the production program, implementation of the program of decrease in electricity losses, decrease in general expenses, decrease in the cost of credit resources, and optimization of investment activities.
The result of implementation of measures aimed to reduce operating costs and to generate additional income in 2014 amounted to RUB 1,350 mln. The result of implementation of measures aimed to reduce financial costs totaled RUB 76 mln. The result of implementation of measures aimed to cut costs in the field of technical re-equipment, reconstruction and new construction in 2014 amounted to RUB 1,260 mln.
| Measures to increase revenue | 497 |
| Improving logistics through carrying out tender procedures | 306 |
| Implementation of the program of decrease in electricity losses | 468 |
| Decrease in general expenses | 81 |
| Decrease in the cost of credit resources | 76 |
| Optimization of investment activities | 1,260 |
| Total | 2,686 |
| Reduced fixed expenses (prices of 2012), RUB thousand | 6,016,518 |
| Quantity of c.u. | 538,215 |
| Reduced fixed expenses counting per 1 c.u. (excluding inflation factors) | 11.18 |
| Decrease in expenses counting per 1 c.u. from the level of 2012, % | — 9.12 % |
| Target | 5.00 % |
Under the development strategy of the grid complex of Russia, the Company should achieve the target indicator of decrease in operating expenses by at least 15% by 2017, considering the level of inflation in 2012 counting per unit of electrical equipment service. The business plan for
In 2014, EBITDA characterizing cash flow generated by the Company before taxes and interest, decreased by RUB 1,072 mln, or 9.5%
The grounds for exclusion of expenses on creation of provision for impairment of investments were that the accrual of provision did not entail any diversion of funds, did not require any sources of funding, and thus formed “paper” losses of the Company. The source of compensation of the losses received in 2014 as a result of impairment of investments placed in Bank Tavrichesky will be recovered annually for 20 years.
However, the growth of revenue by 12.1%
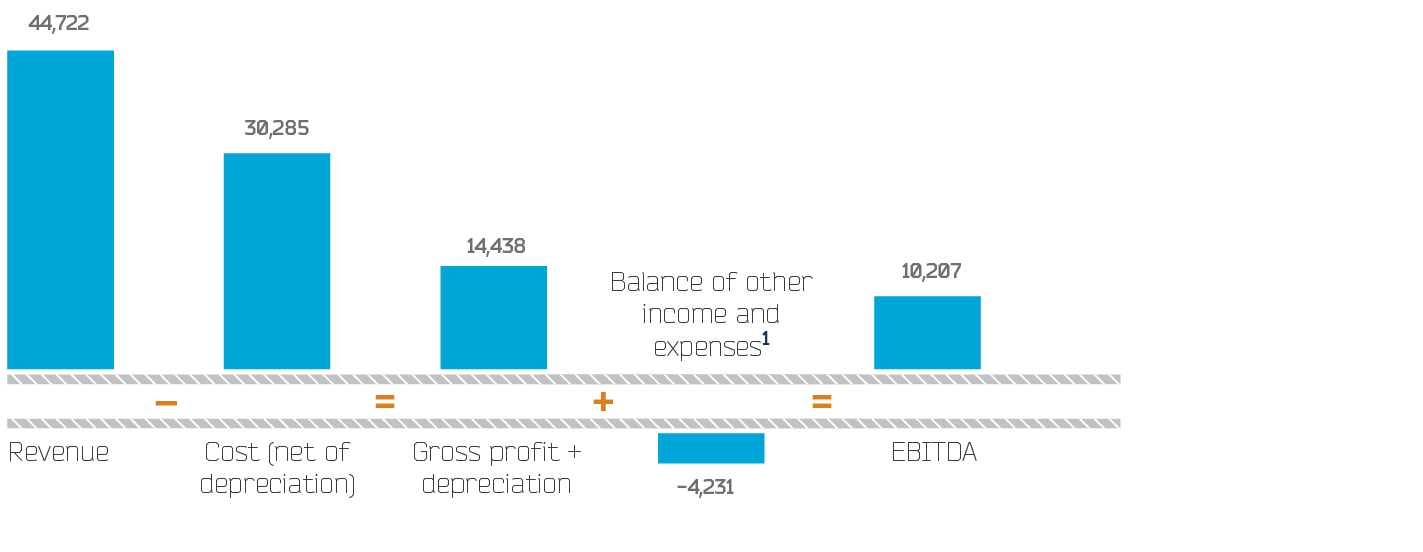
1 Without interest payable and interest receivable, expenses on provision for impairment of investments.
This section was formed on the basis of the balance sheets as at 31 December 2012, 2013 and 2014 (as part of the audited annual accounting statements of Lenenergo for 2014 based on retrospective).
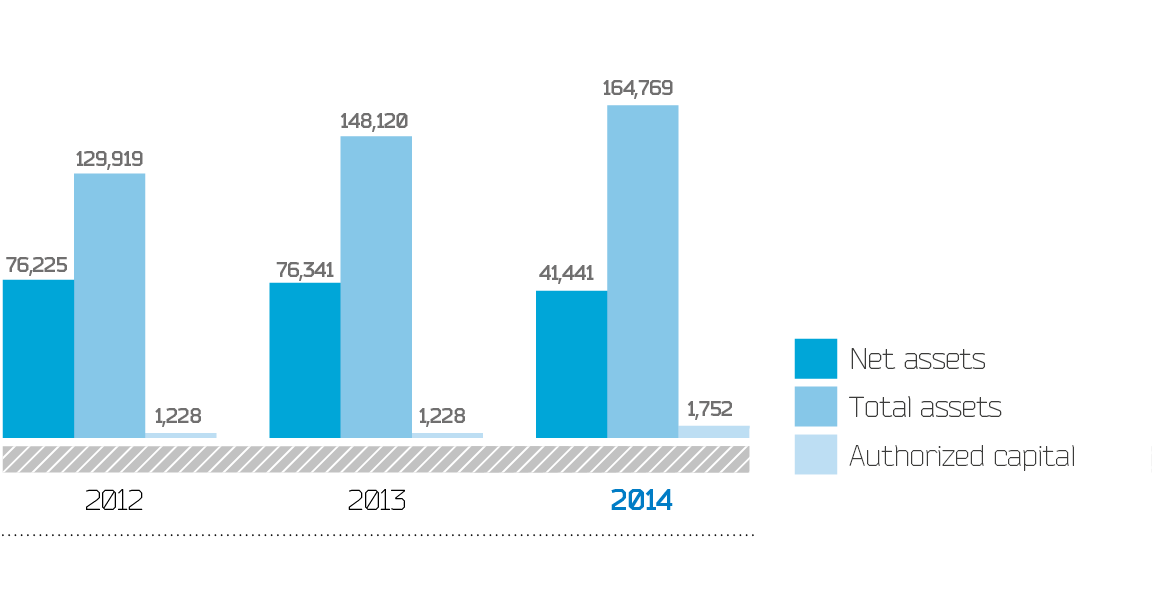
Balance sheet total (i.e. the sum of the assets in the Company’s possession) at the end of 2014 amounted to RUB 164,769 mln. In comparison with the balance sheet as at 31 December 2013 the amount of the Company’s assets and sources of their formation increased by RUB 16,650 mln, or 11.2%
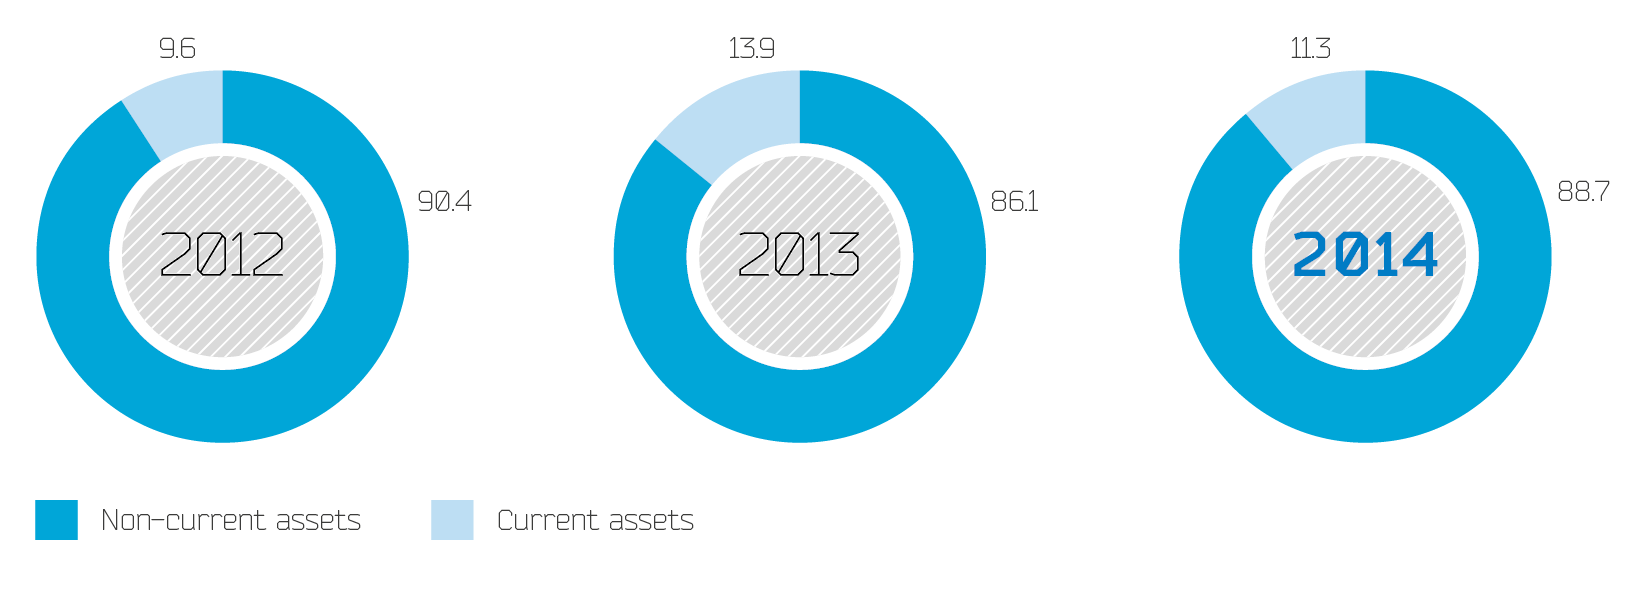
Since Lenenergo is an enterprise related to capital-intensive industry, the structure of its liabilities under the balance sheet is characterized by a great volume of borrowings, and the assets structure is dominated by non-current assets.
At the end of 2014 the balance sheet was characterized by the following features:
| Indicator | Line code (Order # 66n) | Fact as at 31 December 2013, RUB mln | Share in balance sheet total, % | Fact as at 31 December 2014, RUB mln | Share in balance sheet total, % | 2014 / 2013, change | ||
|---|---|---|---|---|---|---|---|---|
| RUB mln | % | Share in balance sheet total, p.p. | ||||||
| ASSETS | ||||||||
| I. NON-CURRENT ASSETS | ||||||||
| Intangible assets | 1110 | 105 | 0.1 | 214 | 0.1 | 109 | 103.6 | 0.0 |
| R&D results | 1120 | 83 | 0.1 | 14 | — | — 69 | — 82.9 | — |
| Property and equipment, including: | 1150 | 124,823 | 84.3 | 139,479 | 84.7 | 14,656 | 11.7 | 0.4 |
| construction in progress | 1154 | 11,753 | 7.9 | 10,559 | 6.4 | — 1,195 | — 10.2 | — 1.5 |
| advances for capital construction and acquisition of property and equipment | 1155 | 458 | 0.3 | 1,008 | 0.6 | 550 | 120.2 | 0.3 |
| Investments | 1170 | 898 | 0.6 | 2,605 | 1.6 | 1,707 | 190.2 | 1.0 |
| Deferred tax assets | 1180 | 980 | 0.7 | 3,343 | 2.0 | 2,363 | 241.2 | 1.4 |
| Other non-current assets | 1190 | 632 | 0.4 | 567 | 0.3 | — 65 | — 10.3 | — 0.1 |
| Total for Section I | 1100 | 127,522 | 86.1 | 146,223 | 88.7 | 18,701 | 14.7 | 2.7 |
| II. CURRENT ASSETS | ||||||||
| Inventory | 1210 | 584 | 0.4 | 681 | 0.4 | 97 | 16.6 | 0.0 |
| Value added tax according to purchased valuables | 1220 | 495 | 0.3 | 941 | 0.6 | 447 | 90.3 | 0.2 |
| Receivables, including: | 1230 | 9,782 | 6.6 | 12,520 | 7.6 | 2,738 | 28.0 | 1.0 |
| long-term receivables | 1231 | 324 | 0.2 | 753 | 0.5 | 429 | 132.7 | 0.2 |
| short-term receivables | 1232 | 9,459 | 6.4 | 11,767 | 7.1 | 2,308 | 24.4 | 0.8 |
| Investments (except cash equivalents) | 1240 | 6,284 | 4.2 | 3,057 | 1.9 | — 3,228 | — 51.4 | — 2.4 |
| Cash and cash equivalents | 1250 | 3,370 | 2.3 | 1,167 | 0.7 | — 2,204 | — 65.4 | — 1.6 |
| Other current assets | 1260 | 82 | 0.1 | 181 | 0.1 | 99 | 120.2 | 0.1 |
| Total for Section II | 1200 | 20,598 | 13.9 | 18,547 | 11.3 | — 2,051 | — 10.0 | — 2.7 |
| Balance | 1600 | 148,120 | 100.0 | 164,769 | 100.0 | 16,650 | 11.2 | — |
| LIABILITIES | ||||||||
| III. CAPITAL AND RESERVES | ||||||||
| Authorized capital | 1310 | 1,228 | 0.8 | 1,752 | 1.1 | 524 | 42.6 | 0.2 |
| Revaluation of non-current assets | 1340 | 51,433 | 34.7 | 51,259 | 31.1 | — 174 | — 0.3 | — 3.6 |
| Additional capital | 1350 | 11,417 | 7.7 | 14,067 | 8.5 | 2,650 | 23.2 | 0.8 |
| Reserve capital | 1360 | 184 | 0.1 | 184 | 0.1 | — | — | — |
| Retained profit (uncovered loss) | 1370 | 12,078 | 8.2 | 4,178 | 2.5 | — 7,900 | — 65.4 | — 5.6 |
| Total for Section III | 1300 | 76,341 | 51.5 | 71,441 | 43,4 | — 4,900 | — 6.4 | — 8.2 |
| IV. NON-CURRENT LIABILITIES | ||||||||
| Borrowings | 1410 | 29,406 | 19.9 | 48,188 | 29.2 | 18,782 | 63.9 | 9.4 |
| Deferred tax liabilities | 1420 | 2,569 | 1.7 | 3,805 | 2.3 | 1,237 | 48.1 | 0.6 |
| Other liabilities | 1450 | 1,907 | 1.3 | 3,213 | 2.0 | 1,307 | 68.5 | 0.7 |
| Total for Section IV | 1400 | 33,881 | 22.9 | 55,207 | 33.5 | 21,326 | 62.9 | 10.6 |
| V. CURRENT LIABILITIES | ||||||||
| Borrowings | 1510 | 3,970 | 2.7 | 1,581 | 1.0 | — 2,389 | — 60.2 | — 1.7 |
| Payables | 1520 | 32,918 | 22.2 | 32,570 | 19.8 | — 348 | — 1.1 | — 2.5 |
| Deferred income | 1530 | — | — | — | — | — | — | — |
| Estimated liabilities | 1540 | 1,010 | 0.7 | 3,970 | 2.4 | 2,960 | 293.2 | 1.7 |
| Total for Section V | 1500 | 37,897 | 25.6 | 38,121 | 23.1 | 224 | 0.6 | — 2.4 |
| Balance | 1700 | 148,120 | 100.0 | 164,769 | 100.0 | 16,650 | 11.2 | — |
As at 31 December 2014, non-current assets amounted to RUB 146,223 mln, or 88.7% of balance sheet total. Property and equipment (including construction in progress and advances for capital construction and acquisition of property and equipment) for the total amount of RUB 139,479 accounted for 84.7% of total assets and 95.4% of non-current assets.
The increase in non-current assets was due to expansion of the investment program, and commissioning and reconstruction of property and equipment during its implementation.
Long-term investments in the amount of RUB 2,605 mln accounted for 1.8% of non-current assets. Their growth by RUB 1,707 mln or 1.0%
As at 31 December 2014 deferred tax assets in the amount of RUB 3,343 mln, or 2.0% of balance sheet total and other non-current assets in the amount of RUB 567 mln accounting for 0.3% of the Company’s assets were reflected in the balance sheet. This line of the balance sheet reflects a number of expenses relating to future periods (the cost of connection to networks of other organizations, insurance contracts, non-exclusive rights to use databases, license agreements, etc.).
Current assets at the end of 2014 totaled RUB 18,547 mln, or 11.3% of balance sheet total, having decreased by RUB 2,051 mln, or 10.0%
The main share in the structure of current assets by the end of 2014 accounted for receivables — 67.5% of current assets, or RUB 12,520 mln.
Cash and short-term investments (bank deposits) in aggregate amount to RUB 4,223 mln and rank second in the structure of current assets accounting for 22.8% of their value. The most liquid assets include funds from additional issue and other funds to finance the investment and operating activities net of the provision for impairment of investments established in connection with the problems of Bank Tavrichesky.
Moreover, current assets reflect stocks, VAT on purchased assets and other current assets (VAT on advances for capital construction and acquisition of property and equipment).
Decrease in current assets by the end of 2014 was generally due to the decline in short-term investments (by RUB 3,228 mln) and cash (by RUB 2,204 mln which were used to finance the Company’s activities), whereas all other components of current assets grew to a lesser extent. Reduction of short-term investments was influenced by creation of provision for impairment of investments in Bank Tavrichesky.
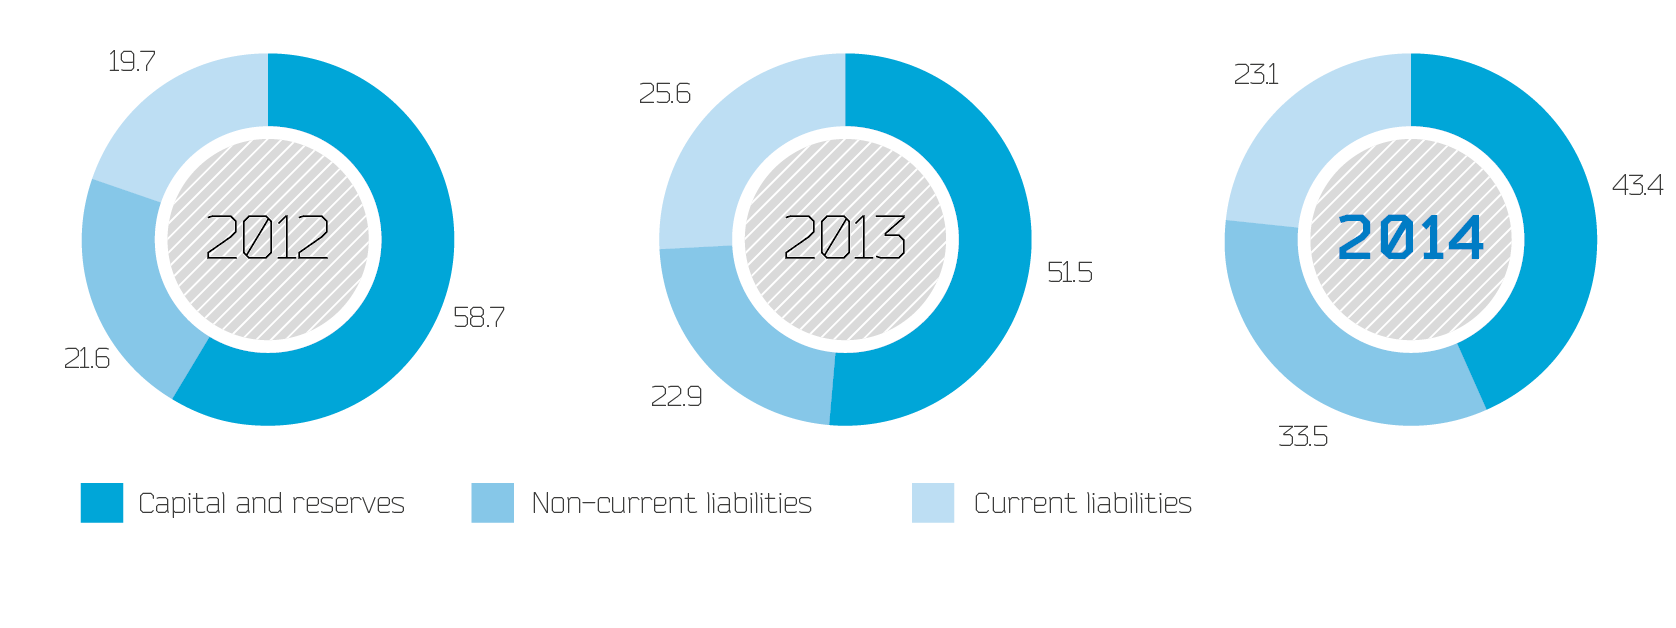
Own sources of the Company’s assets in the amount of RUB 71,441 mln accounted for 43.4% of balance sheet total. The main share was revaluation of non-current assets (71.8 % of equity funds). Additional capital accounted for 19.7%, authorized capital — 2.5%, and total financial result (of previous years and the reporting year) — 5.8% of Section III Capital and Reserves.
Compared to 2013, capital and reserves dropped by RUB 4,900 mln, or 6.4 %, due to receiving by results of the reporting year of considerable uncovered loss totaling RUB 7,968 mln. The positive impact on the value of capital and reserves was rendered by records of the results of additional issue of shares resulting in the growth of the authorized and additional capital of the Company.
In 2014, there were no changes in the amount of reserve capital, and funds of the created reserve fund were not used in the reporting year.
In accordance with the Charter “the Company forms the reserve fund in the amount of fifteen (15) percent of the authorized capital. The amount of obligatory annual deductions to the reserve fund is not less than five (5) percent of net profit until the reserve fund reaches the established size. The reserve fund is intended to cover the Company’s losses in case of lack of other funds. The reserve fund cannot be used for other purposes”.
The size of reserve capital of Lenenergo at the end of 2014 amounts to RUB 184 mln, or 10.5% of the authorized capital, and will be brought to the size required by the Charter (15% of the authorized capital, or RUB 263 mln) through payments to the reserve capital of RUB 79 mln as a result of distribution of the net profit received by the Company in subsequent years (in 2014 Lenenergo received uncovered loss).
Liabilities of Lenenergo (sections IV and V of the balance sheet net of deferred tax liabilities, deferred income and estimated liabilities) as at 31 December 2014 amounted to RUB 85,553 mln, including:
Non-current liabilities (section IV of the balance sheet) were the second largest after equity capital, the source of assets accounting for 32.2% of balance sheet total. They were generated for 87.3% due to the long-term borrowings in total amount of RUB 48,188 mln.
The increase in non-current liabilities by RUB 21,326 mln, or 62.9 %
Current liabilities accounted for 23.1% of the sources of assets. The greatest share in current liabilities accounted for short-term payables — 85.4% of total current liabilities, and 19.8% of all funding sources. Short-term payables decreased by RUB 348 mln, or 1.1%
As at 31 December 2014 (1.0% of all sources of assets) the following items were reflected in the structure of short-term borrowings:
Short-term borrowings decreased by RUB 2,389 mln, or 60.2% relative to 31 December 2013 due to reduction of debt on the loans and credits included in current liabilities as at 31 December 2014.
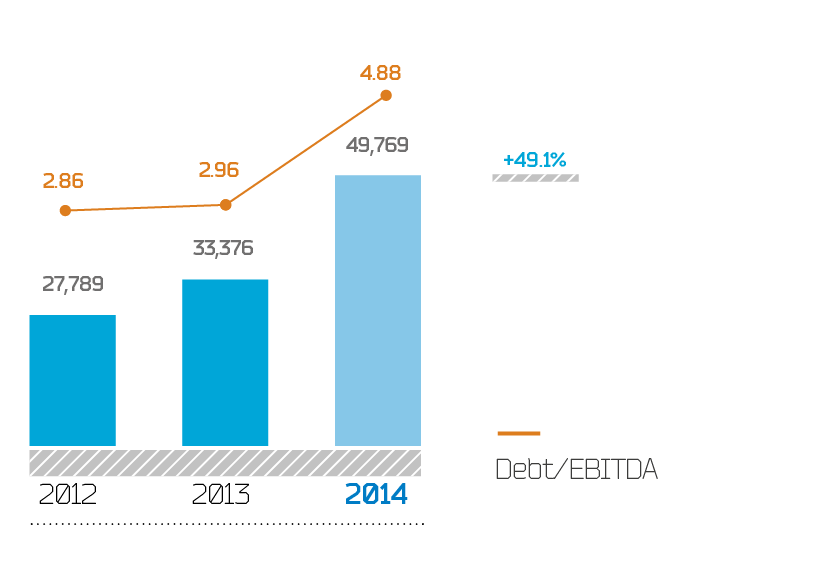
However, the overall amount of debt (debt on long-term and short-term loans and credits, including arrears of interest) increased by RUB 16,393 mln, 49.1%
| Indicator | As at 31.12.2012 | As at 31.12.2013 | As at 31.12.2014 |
|---|---|---|---|
| Receivables, including: | 6,278 | 9,782 | 12,520 |
| payments expected more than 12 months after the reporting date | 201 | 324 | 753 |
| buyers and customers | 5 | 3 | 203 |
| prepayments | 118 | 33 | 4 |
| other receivables | 79 | 288 | 546 |
| Payments expected within 12 months after the reporting date | 6,076 | 9,459 | 11,767 |
| buyers and customers | 2,790 | 5,895 | 6,866 |
| prepayments | 256 | 540 | 1,051 |
| other receivables | 3,030 | 3,024 | 3,850 |
Total receivables of Lenenergo at the beginning of the reporting period amounted to RUB 13,887 mln, and as at 31.12.2013 — RUB 10,777 mln. Receivables net of provision for bad debts as at 31.12.2014 totaled RUB 12,520 mln, and as at 31.12.2013 — RUB 9,782 mln.
As at 31.12.2014 the provision for bad debts in the amount of RUB 1,367 mln was formed, including for doubtful receivables in the amount of RUB 1,367 mln (reflected in the balance sheet as reduction of receivables); advances for acquisition of plant and equipment amounted to RUB 114 mln (reflected in the balance sheet as non-current assets and as reduction of debt on prepayments).
The Company deals with pre-trial and judicial settlement of disagreements with contractors.
Throughout the year, uncollectible receivables in the amount of RUB 142 mln were written-off.
| Indicator | As at 31.12.2012 | As at 31.12.2013 | As at 31.12.2014 |
|---|---|---|---|
| The table shows total receivables including long-term receivables reflected on line 1450 of the balance sheet, and short-term receivables reflected on line 1520 of the balance sheet.Payables, including: | 35,784 | 34,824 | 22,855 |
| suppliers and contractors | 19,039 | 14,030 | 6,517 |
| debt on wages payable to employees | 227 | 235 | 155 |
| debt to government extrabudgetary funds | 86 | 76 | 86 |
| debt on taxes and fees | 225 | 642 | 361 |
| advances received | 14,111 | 15,570 | 15,209 |
| other payables | 2,095 | 4,272 | 527 |
In 2014, payables increased by RUB 959 mln compared to 2013, and as at 31.12.2014 amounted to RUB 35,784 mln. The changes were as follows:
Debt under the items “debt on wages payable to employees” and “debt on taxes and fees” is current.
Overdue accounts payable of Lenenergo in 2014 amounted to RUB 1,953 mln.
Overdue payables are attributable to prepayments on the contracts for technological connection to electric networks. Violation of the terms of performance of obligations by the Company was due to the fact that the connection of consumers to electric networks is carried out in conditions of shortage of capacity in St. Petersburg and the Leningrad Region. In addition, the violation of the terms of performance of obligations was related to the long delay in the approval of permits for construction of power grid facilities and in some cases — to unfair execution of works on construction of grid facilities by the contractors engaged by the Company for implementation of activities on technological connection of subscribers, and non-fulfilment by subscribers of the specifications for connection.
Lenenergo on a continuous basis carries out work to reduce the amount of accumulated obligations under the contracts on technological connection to electric networks, including:
| Indicator | Unit | 2012 | 2013 | 2014 | 2014 / 2013, p.p. (unless otherwise specified) |
For reference: formula |
|---|---|---|---|---|---|---|
| Financial stability | ||||||
| Cost of net assets | RUB mln | 76,225 | 76,341 | 71,441 | — 6.4% | Order of the Ministry of Finance of Russia of 28 August 2014, # 84n |
| Level of overdue payables | % | 3.0 | 2.3 | 2.1 | –0.2 | Arrears/(Line 1400 + Line 1500 f.1) |
| Equity-assets ratio | — | 0.59 | 0.52 | 0.43 | — | Line 1300 f.1/Line 1700 f.1 |
| Debt to equity ratio | — | 1.42 | 1.06 | 0.77 | — | (Line 1300 f.1)/(Line 1400+1500) (f.1) |
| Debt/EBITDA | — | 2.86 | 2.96 | 4.88 | — | (Line 1410 f.1 + Line 1510 f.1)/ EBITDA |
| Net debt/EBITDA | — | 2.30 | 2.10 | 4.46 | — | (Line 1410 f. 1 + Line 1510 f.1 — Line 1240 f.1 — Line 1250 f.1) / EBITDA |
| Profitability | ||||||
| EBITDA margin | % | 26.83 | 28.27 | 22.82 | — 5.44 | (EBITDA / Sales revenue (Line 2110 f.2))x100% |
| Net profit margin | % | 2.87 | 1.06 | — 17.82 | — 18.88 | (Line 2400 f.2/Sales revenue (Line 2110 f.2))x100% |
| ROTA on profit before tax | % | 1.65 | 1.04 | — 5.62 | — 6.66 | (Profit before tax/Total assets) x 100%=[Line 2300 f.2/((Line 1600 f.1 report + Line 1600 f.1 base)/2)]x100% |
| ROE | % | 1.57 | 0.56 | — 10.78 | — 11.34 | (Net profit/Equity capital) x100%= [Line 2400 f.2/((Line 1300 f.1 report+ Line 1300 f.1 base)/ 2)]x100% |
| Business activity | ||||||
| Assets turnover | times | 0.28 | 0.27 | 0.27 | — | Line 2110 f.2/Line 1600 f.1 |
| Receivables turnover | times | 5.78 | 4.08 | 3.57 | — | Line 2110 f.2/(Line 1230 — Line 123204) f.1 |
| Payables turnover | times | 1.44 | 1.05 | 1.10 | — | Line 2120 f.2/(Line 1450 + Line 1520) f.1 |
| Receivables and payables growth rates ratio | times | 0.84 | 1.01 | 1.29 | — |
GRR= Line 1230 f.1 report/Line 1230 f.1 base GRP= Line 1520 f.1 report/Line 1520 f.1 base GRR/GRP = (Line 1230 f.1 report/Line 1230 f.1 base) / (Line 1520 f.1 report/Line 1520 f.1 base) |
| Total receivables and payables ratio | times | 0.27 | 0.28 | 0.35 | — | Line 1230 f.1/(Line 1450 f.1 + Line 1520 f.1) |
| Most liquid receivables and payables ratio | times | 0.84 | 0.49 | 0.51 | — | (Line 123201 f.1+ Line 123206 f.1)/ (Line 1521 f.1+ Line 1528 f.1) |
| Liquidity | ||||||
| Cash ratio | — | 0.21 | 0.25 | 0.11 | — |
(Cash and cash equivalents + Short-term investments) / Current liabilities = (Line 1240 f.1+ Line 1250 f.1)/Line 1500 f.1 |
| Quick ratio | — | 0.45 | 0.51 | 0.42 | — |
(Cash and cash equivalents + Short-term investments + Receivables less than 12 months + Other current assets)/ Current liabilities = (Line 1260 f.1+ Line 1250 f.1+ Line 1240 f.1+ Line 1232 f.1)/ Line 1500 f.1 |
| Current ratio | — | 0.49 | 0.54 | 0.49 | — | Current assets / Current liabilities = Line 1200 f.1/Line 1500 f.1 |
As a result of the deterioration of the financial result received by the end of 2014, the amount of net assets of Lenenergo reduced
At the year-end, the share of equity capital accounted for 43.4% of balance sheet total of Lenenergo. A significant share of equity on the balance sheet indicates a relatively high level of financial independence of the Company, despite the growth of liabilities. Thereto, the most stable liabilities (equity capital and non-current liabilities) together account for 76.9% of balance sheet total.
Deterioration of financial stability (equity-assets ratio, debt to equity ratio, Debt/EBITDA) relative to 2013 was due to the increase in arrears of loans and credits attracted mainly to finance the investment program at simultaneous deterioration of the financial result.
In 2014, the profitability indicators of Lenenergo (except EBITDA margin) take negative values due to the loss of Company’s activities in 2014.
The decrease in EBITDA margin, reflecting the amount of EBITDA per each ruble of revenue earned by the Company in 2014, due to the mixed changes in EBITDA (decrease) and revenue (growth). ROE reflects the amount of profit earned by its owners per each ruble invested in the Company.
Its decrease
The main negative impact on profitability in 2014 was provided by creation of provision for impairment of investments in connection with the problems of Bank Tavrichesky and expenses on creation of provision for estimated liabilities on existing disagreements with third-party grid organizations.
Receivables turnover reflects the rate at which buyers (debtors) pay off their obligations to the Company. By the end of 2014 it was 3.57 times and decreased by 0.51 p.p.
The length of payables turnover characterizes the average length of a grace period provided to the Company by its suppliers. In 2014, the length of receivables turnover was significantly lower than the length of payables turnover.
Total receivables and payables ratio grew by 0.07 p.p. by the end of 2014 due to the excess of the growth rate of receivables relative to the growth rate of payables.
At the same time, in 2014 the indicator characterizing most liquid receivables and payables ratio did not essentially change and the increase amounted to only 0.02 p.p.
The values of cash, quick and current ratios by the end of 2014 reduced. This was due to the decrease in the amount of current assets at a simultaneous increase of current liabilities.
In terms of economic instability in the country and the uncertainty in the financial markets achievement by Lenenergo of positive results from its operating activities and increase of its investment appeal is becoming particularly urgent. This comprises:
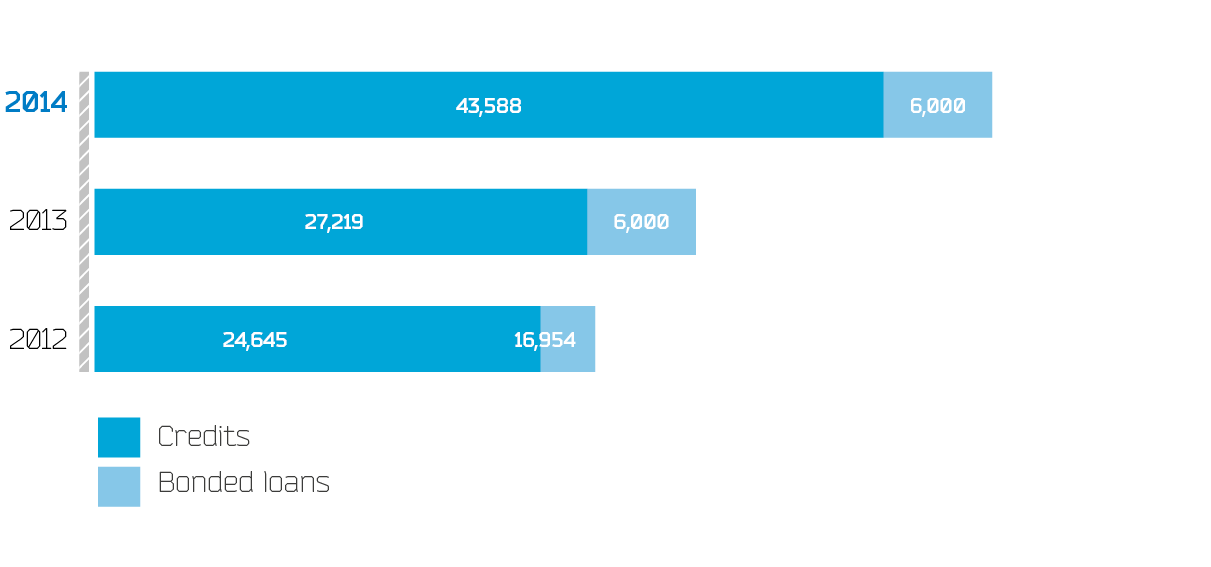
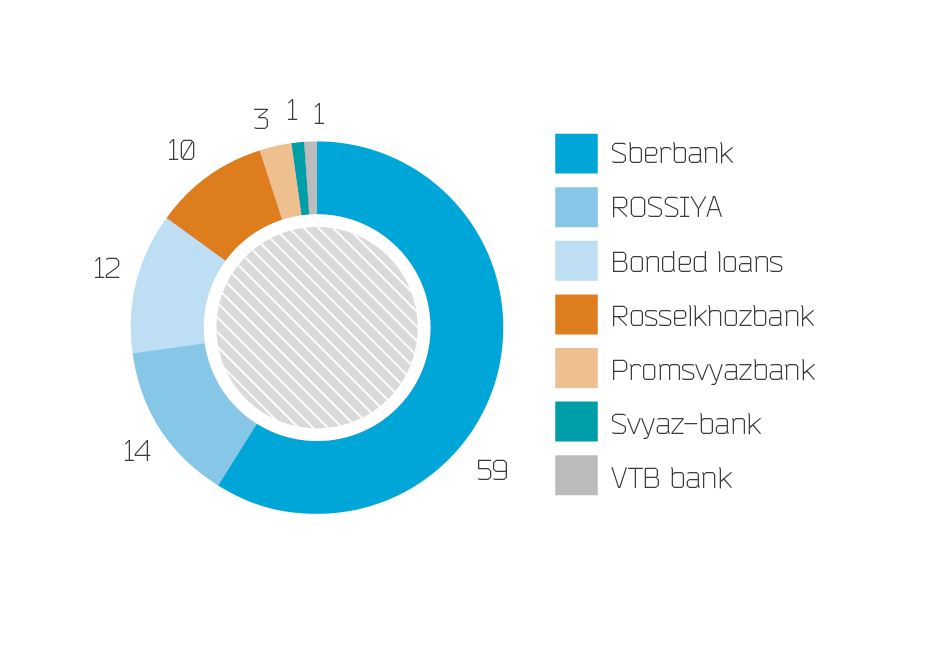
For the purpose of financing the investment program and refinancing its debt the Company applies all available methods to attract borrowings: bank loans and bonds (corporate and exchange). The decisions on attraction of extra financial resources are based on the principle of providing lower cost of funding along with increased terms of borrowings.
For the purpose of financing the investment program and refinancing its debt the Company applies all available methods to attract borrowings: bank loans and bonds (corporate and exchange). The decisions on attraction of extra financial resources are based on the principle of providing lower cost of funding along with increased terms of borrowings.
Lenenergo activities in the field of attraction of credit resources are carried out in accordance with the Regulations on credit policy approved by the Board of Directors (Minutes #8 of 11 October 2013), the limits of borrowings’ cost parameters approved by the Board of Directors and the approved Business plan. In accordance with the specified documents, the Company has introduced the system of limits on the amount of borrowings enabling to forecast the solvency of the Company, and the powers of management for making financial decisions in the field of crediting have been established.
After calculation of the compliance of Lenenergo debt position to the limits of the debt position established in the Regulations on credit policy, the group of solvency (A, B or C) is defined, that also affects the powers of management for making financial decisions in the field of crediting. The limits of borrowings’ cost parameters are defined based on the refinancing rate, the term of loan and availability of collateral for the date of borrowings.
| Indicator | 2012 | 2013 | 2014 | 2014 / 2013, % |
For reference: formula |
|---|---|---|---|---|---|
| Equity capital, RUB mln | 76,225 | 76,341 | 71,441 | — 6.4 | Line 1300 f.1 |
| Loan capital, RUB mln, including: | 53,694 | 71,779 | 93,329 | 30.0 | Line 1400 + Line 1500 f.1 |
| loans and credits | 27,789 | 33,376 | 49,769 | 49.1 | Line 1410 + Line 1510 f.1 |
| payables | 22,855 | 34,824 | 35,784 | 2.8 | Line 1450 + Line 1520 f.1 |
| Debt to equity ratio | 1.42 | 1.06 | 0.77 | - | Line 1300/(Line 1400 + Line 1500) f.1 |
| Debt/EBITDA | 2.86 | 2.96 | 4.88 | - | (Line 1410 + Line 1510) f.1/EBITDA |
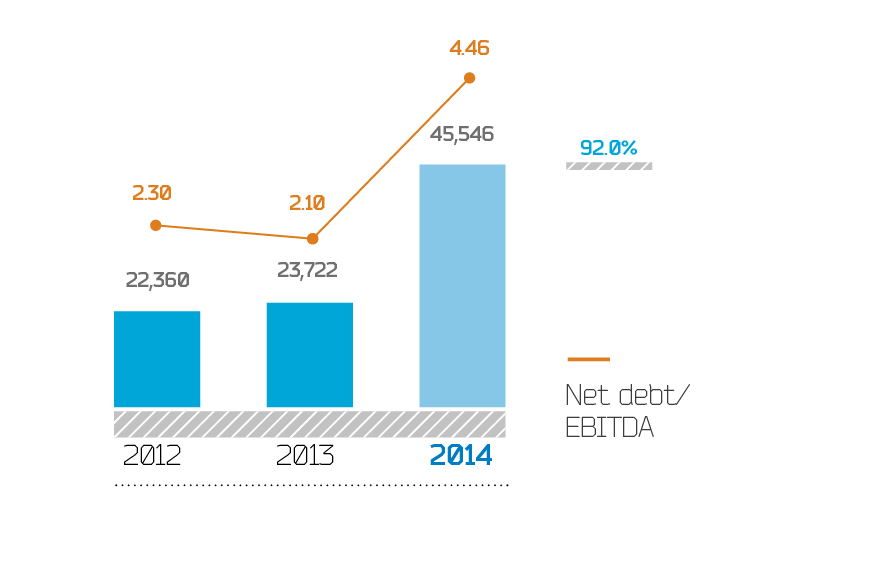
| Net debt, RUB mln | 22,360 | 23,722 | 45,546 | 92.0% | Line 1410 + Line 1510 — Line 1240 — Line 1250 f.1 |
| Net debt/EBITDA | 2.30 | 2.10 | 4.46 | - | (Line 1410 + Line 1510 — Line 1240 — Line 1250 f.1) / EBITDA |
| Interest payable, RUB mln | 1,788 | 2,217 | 2,766 | 24.8 | Line 2330 of PLS |
| EBITDA/Interest payable | 5.44 | 5.09 | 3.69 | - | EBITDA / Line 2330 of PLS |
| For reference: | |||||
| EBITDA, RUB mln | 9,733 | 11,279 | 10,207 | — 9.5 | Line 2400 f.2+ Line 2330 f.2 + Depreciation + Profit tax f.2 — Line 2320 f.2 + Creation of provision for impairment of debt investments |
In
By the end of 2014, Debt/EBITDA increased by 1.92
Net debt/EBITDA also increased compared with the beginning of the year due to the increase in the amount of net debt (driven by the growth of debt at a simultaneous decrease in the most liquid assets), while EBITDA reduced in 2014.
| Indicator | 2012 | 2013 | 2014 | 2014 /2013, p.p. |
|---|---|---|---|---|
| Average weighted rate of borrowing on all funds (including bonded loans) | 8.26 | 8.14 | 9.51 | 1.37 |
| Average weighted rate of borrowing on bank credits | 8.23 | 8.09 | 9.67 | 1.58 |
| Refinancing rate of the Central Bank of Russia | 8.25 | 8.25 | 8.25 | 0.00 |
Dynamics of the average weighted interest rate on borrowings by the end of 2014 was characterized by the tendency to increase in terms of the rates growth under existing contracts and deterioration of the situation on the capital market in general.
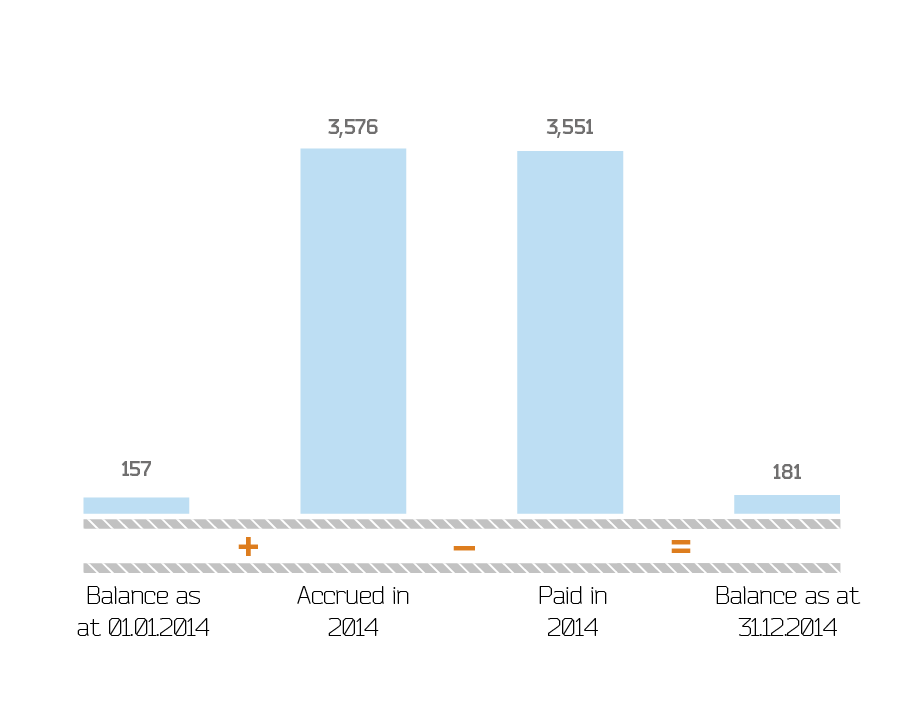
| Type of borrowings | Loan portfolio as at 01 January 2014 |
Borrowed in 2014 |
Paid in 2014 |
Loan portfolio as at 31 December 2014 |
|---|---|---|---|---|
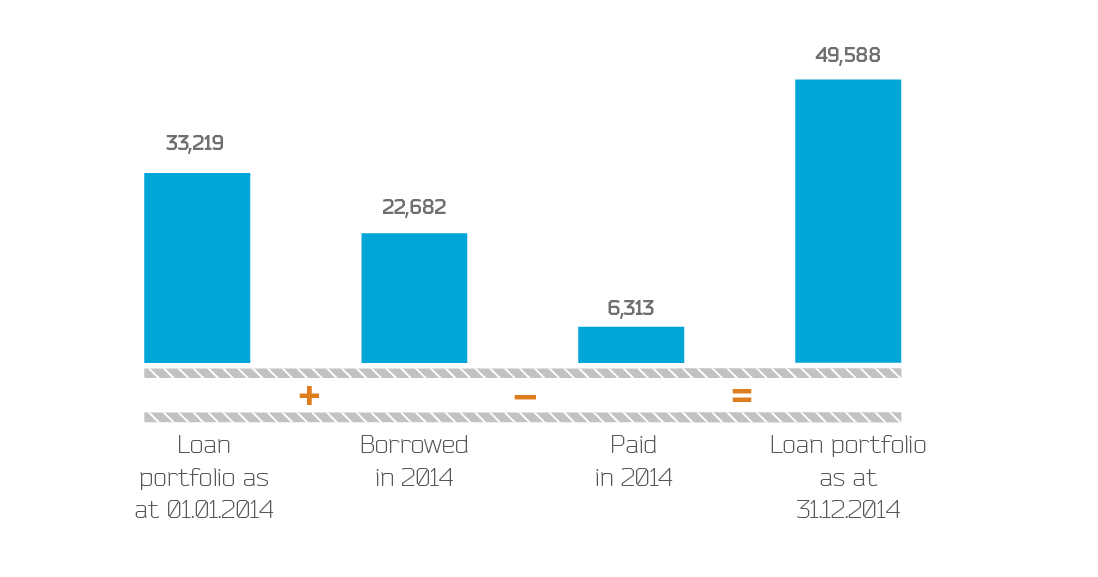
| Credits | 33,219 | 22,682 | 6,313 | 49,588 |
| Interest on credits | 157 | 3,576 | 3,551 | 181 |
| Total | 33,376 | 26,258 | 9,865 | 49,769 |
In 2014, the increase in the loan portfolio was driven by the growth of borrowings attracted to finance investment activities.
| Agency | Rating | Assignment date | Forecast | Rating action | ||
|---|---|---|---|---|---|---|
| International scale | Probability of default | National scale | ||||
| Moody’s Investors Service/Moody’s Interfax | Ba2 | Ba2-PD | Aa2.ru | 18 November 2009 | Stable |
7 February 2014 3 April 2014 |
| On review for downgrade | 23 December 2014 | |||||
| Negative | 25 March 2015 | |||||
In November 2009, the international rating agency Moody’s assigned Lenenergo long-term credit rating on the international scale at Ba2 (stable), and on the national scale — at Aa2.ru (stable). On 7 February 2014, the rating agency affirmed the ratings of Rosseti and Lenenergo and other rated companies of the Group with stable outlook. This stand-alone credit profile of the Company is estimated by the Agency at Ba3, and one level to the rating the agency gives for the probability of providing the Company timely support from the state through its primary shareholder. On 3 April 2014, the agency despite the revision of outlooks on the ratings of many Russian grid companies affirmed the credit ratings of Lenenergo on the same level at Ba2 and preserved the stable outlook. In its reports for 2014, the agency notes the strategic importance of the Company’s presence in the region. In addition, Moody’s views positively the prospects of development of the Company and the ability of Lenenergo to preserve financial stability in the volatile environment.
Against the backdrop of escalation of the situation in Ukraine, deterioration of macroeconomic indicators, a sharp drop in oil prices and devaluation of the national currency, Moody’s has repeatedly revised the credit ratings of the Russian Federation and major Russian companies in 2014. On 23 December 2014 Moody’s put the credit ratings of Lenenergo and other 44 Russian non-financial organizations on review for downgrade. This decision was made following the lowering by Moody’s of the ceiling on non-sovereign ratings of the Russian Federation by one notch.
However, stand-alone credit profile of Lenenergo has remained at the same level.
In addition, on 27 March 2014 Standard & Poor’s has assigned Rosseti long-term credit rating of BBB- on the international scale and ruAAA on the national scale.
At the same time, according to the Ministry of Finance of the Russian Federation, the outlook of the sovereign credit rating assigned by Moody’s is unduly conservative, since the pessimism of Moody’s forecasts surpasses the estimates of all other financial organizations (including IMF, World Bank and international banks), and provided information about the anti-crisis decisions of the Government of the Russian Federation was not considered by Moody’s.
Events after the reporting date
On 25 March 2015, Moody’s confirmed the credit ratings of Lenenergo at Ba2 on the international scale, Aa2.Ru on the national scale, and probability of default — Ba2-PD. The negative outlook on the rating of Lenenergo is caused by a similar outlook on the sovereign rating of the Russian Federation, as well as by generally pessimistic estimates of the agency regarding the economic situation in Russia in short- and medium-term.
The forecast of financial results of Lenenergo is based on the financial-economic model of the Company’s development in
In general, when making the forecast of its performance the Company considered the impact of adverse macroeconomic conditions and liquidity shortage at its basic bank, crisis phenomena in the assessment of current and forecasted demand for services, business slowdown and fall in investment activity in the regions of its presence, and tariff and balance decisions approved by the regional regulators for 2015.
| Indicator | Unit | 2014 | 2015 | 2016 | 2017 | 2018 | 2019 | 2019/2014, % (unless otherwise specified) |
For reference: formula |
|---|---|---|---|---|---|---|---|---|---|
| Fact | Plan | Forecast | Forecast | Forecast | Forecast | ||||
| Book value of assets | RUB mln | 164,769 | 162,661 | 161,512 | 170,125 | 182,176 | 19, 401 | 18.0 | Line 1600 f.1 |
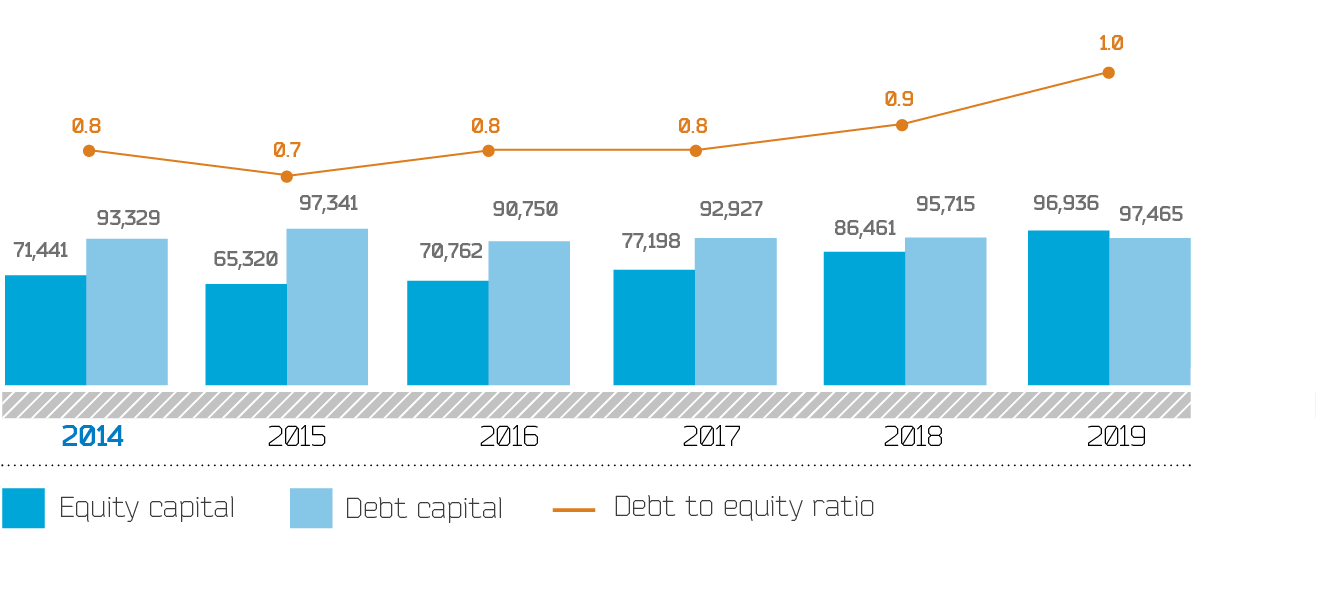
| Equity capital | RUB mln | 71,441 | 65,320 | 70,762 | 77,198 | 86,461 | 96,936 | 35.7 | Line 1300 of BS |
| Net assets | RUB mln | 71,441 | 65,900 | 70,762 | 77,198 | 86,461 | 96,936 | 35.7 |
Order #84n of 28 August 2014 of the Ministry of Finance of Russia |
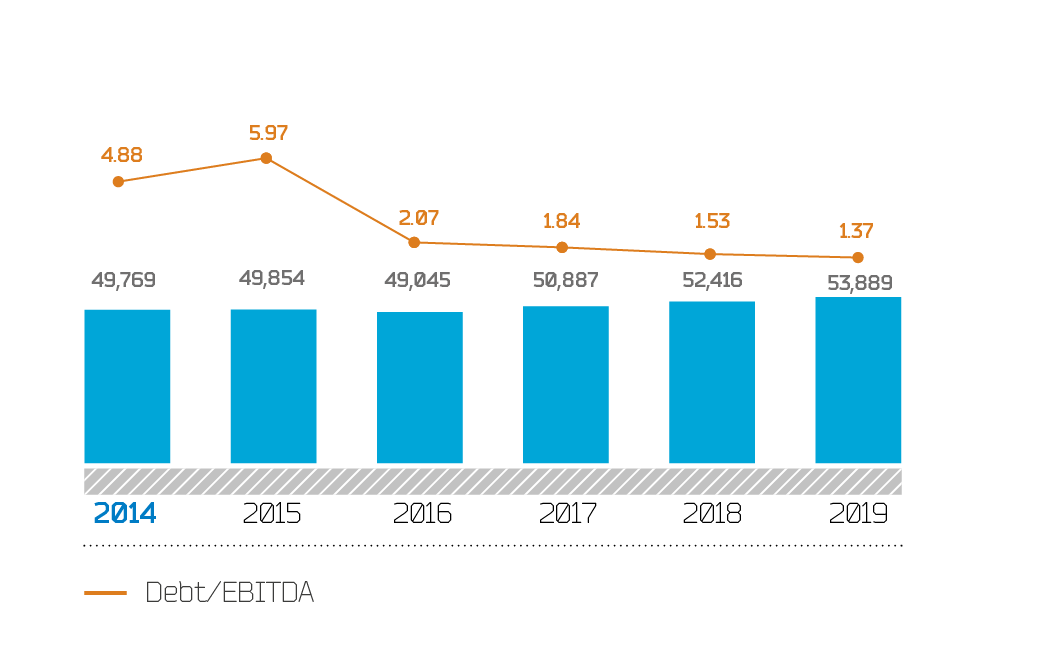
| Debt for the period end | RUB mln | 49,769 | 49,854 | 49,045 | 50,887 | 52,416 | 53,889 | 8.3 | Line 1410 + Line 1510 |
| Net debt | RUB mln | 45,546 | 47,837 | 47,855 | 50,679 | 52,191 | 53,527 | 17.5 | Line 1410 + Line 1510 —Line 1240 — Line 1250 (f.1) |
| Sales revenue, including: | RUB mln | 44,722 | 44,159 | 58,735 | 67,396 | 77,467 | 85,709 | 91.6 | Line 2110 of PLS |
| from electricity transmission | RUB mln | 36,261 | 40,330 | 50,264 | 60,092 | 70,568 | 80,882 | 123.1 | — |
| from technological connections | RUB mln | 8,249 | 3,643 | 8,278 | 7,103 | 6,692 | 4,616 | –44.0 | — |
| from other services | RUB mln | 212 | 186 | 193 | 201 | 207 | 211 | –0.2 | — |
| Cost | RUB mln | 39,257 | 44,656 | 47,175 | 51,340 | 55,922 | 60,018 | 52.9 | Line 2120 of PLS |
| Sales profit | RUB mln | 5,466 | –497 | 11,560 | 16,055 | 21,545 | 25,691 | 370.1 | Line 2200 (f. 2) |
| Profit before tax | RUB mln | –8,793 | –6,121 | 7,695 | 10,708 | 14,978 | 17,568 | 299.8 | Line 2300 (f. 2) |
| Net profit | RUB mln | –7,968 | –6,121 | 5,443 | 7,796 | 11,212 | 13,278 | 266.6 | Line 2400 (f. 2) |
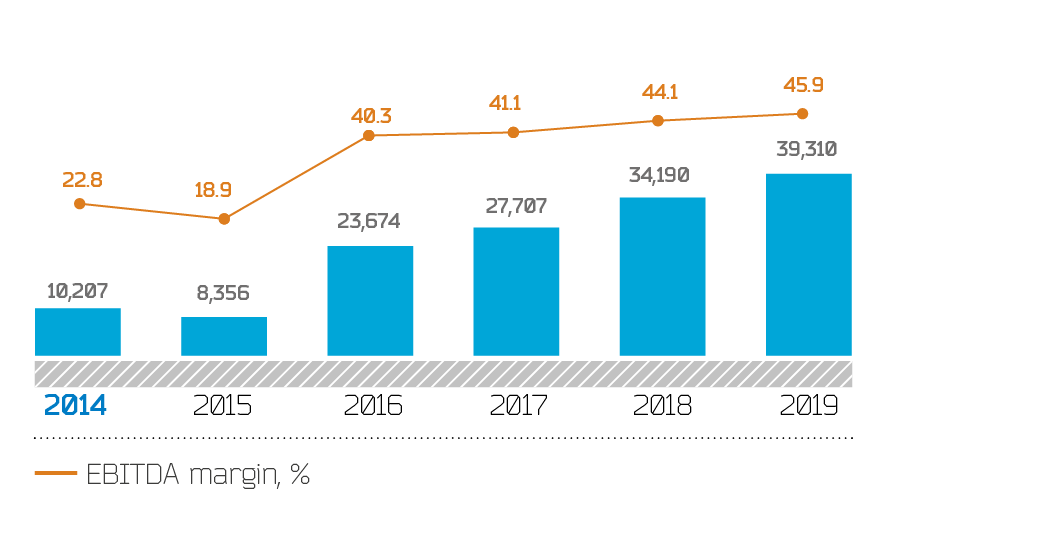
| The forecast of EBITDA starting from 2015 is calculated as Net profit + Profit tax + Depreciation + Interest payable.EBITDA | RUB mln | 10,207 | 8,356 | 23,674 | 27,707 | 34,190 | 39,310 | 285.1 | Net profit + Profit tax + Depreciation + Interest payable — Interest receivable + Creation of provision for impairment of debt investments |
| The forecast of EBITDA starting from 2015 is calculated as Net profit + Profit tax + Depreciation + Interest payable.EBITDA margin | % | 22.8 | 18.9 | 40.3 | 41.1 | 44.1 | 45.9 | +23.0 p.p. | (EBITDA/Sales revenue (Line 2110 f. 2)) x 100% |
| The forecast of EBITDA starting from 2015 is calculated as Net profit + Profit tax + Depreciation + Interest payable.Net debt/EBITDA | — | 4.46 | 5.72 | 2.02 | 1.83 | 1.53 | 1.36 | –3.10 p.p. | (Line 1410 + Line 1510 — Line 1240 — Line 1250 f.1)/EBITDA |
| The forecast of EBITDA starting from 2015 is calculated as Net profit + Profit tax + Depreciation + Interest payable.Debt/EBITDA | — | 4.88 | 5.97 | 2.07 | 1.84 | 1.53 | 1.37 | –3.51 p. | (Line 1410 f.1 + Line 1510 f.1) / EBITDA |
| ROE | % | –10.78 | –8.95 | 8.00 | 10.54 | 13.70 | 14.48 | +25.26 p.p. | [Line 2400 f.2/((Line 1300 f.1 report +Line 1300 f.1 base)/2)] x 100% |
| ROTA on profit before tax | % | –5.62 | –3.74 | 4.75 | 6.46 | 8.50 | 9.33 | +14.95 p.p. | [Line 2300 f.2/((Line 1600 f.1 report+ Line 1600 f.1 base)/2)] x 100% |
| Cash ratio | — | 0.111 | 0.035 | 0.022 | 0.004 | 0.004 | 0.010 | –0.101 p.p. |
(Line 1240 f.1 + Line 1250 f.1) / Line 1500 f.1 |
| Quick ratio | — | 0.42 | 0.23 | 0.20 | 0.20 | 0.19 | 0.29 | –0.14 p.p. | (Line 1260 f.1+ Line 1250 f.1+ Line 1240 f.1 + Line 1232 f.1)/Line 1500 f.1 |
| Current ratio | — | 0.49 | 0.27 | 0.24 | 0.24 | 0.23 | 0.34 | –0.15 p.p. | Line 1200 f.1/Line 1500 f.1 |
| Equity-assets ratio | — | 0.43 | 0.40 | 0.44 | 0.45 | 0.47 | 0.50 | +0.07 p.p. | Line 1300 f.1/Line 1700 f.1 |
| Working capital financed by equity to total assets ratio | — | –1.10 | –2.80 | –3.22 | –3.12 | –3.38 | –1.98 | –0.89 p.p. | Current assets — Receivables over 12 months — Current liabilities)/ Current assets (Line 1200 f.1 — Line 1231 f.1 — Line 1500 f.1)/Line 1200 f. 1 |
| Debt to equity ratio | — | 0.8 | 0.7 | 0.8 | 0.8 | 0.9 | 1.0 | +0.2 p.p. | (Line 1300) / (Line 1700) (f.1) |
| Receivables and payables growth rates ratio | — | 1.29 | 0.84 | 1.00 | 1.00 | 0.97 | 1.02 | –0.27 p.p. |
GRR= Line 1230 f.1 report/Line 1230 f. 1 base GRP= Line 1520 f. 1 report/Line 1520 f. base GRR / GRP= (Line 1230 f.1 report/Line 1230 f.1 base)/ (Line 1520 f.1 report/ Line 1520 f.1 base) |
| Total receivables and payables ratio | — | 0.35 | 0.30 | 0.30 | 0.30 | 0.29 | 0.30 | –0.05 p.p. | Line 1230/ (Line 1520 + Line 1450 of BS) |
| Most liquid receivables and payables ratio | — | 0.51 | 0.46 | 0.48 | 0.46 | 0.43 | 0.45 | –0.06 p.p. | (Line 123201 f.1+ Line 123206 f.1)/ (Line 1521 f.1+ Line 1528 f.1) |
| Leverage | % | 41.1 | 43.3 | 40.9 | 39.7 | 37.7 | 35.7 | –5.3 p.p. | (Line 1410 + Line 1510) / (Line 1410 + Line 1510 + Line 1300) (f.1) |
By 2019, Lenenergo plans to improve its financial position as evidenced by the positive dynamics of the majority of key performance indicators
The revenue growth in 2019 compared to 2014 is expected at the level of 91.6% (1.92 times), substantially outpacing the growth rates of cost (1.53 times). A significant growth of revenue from electricity transmission in
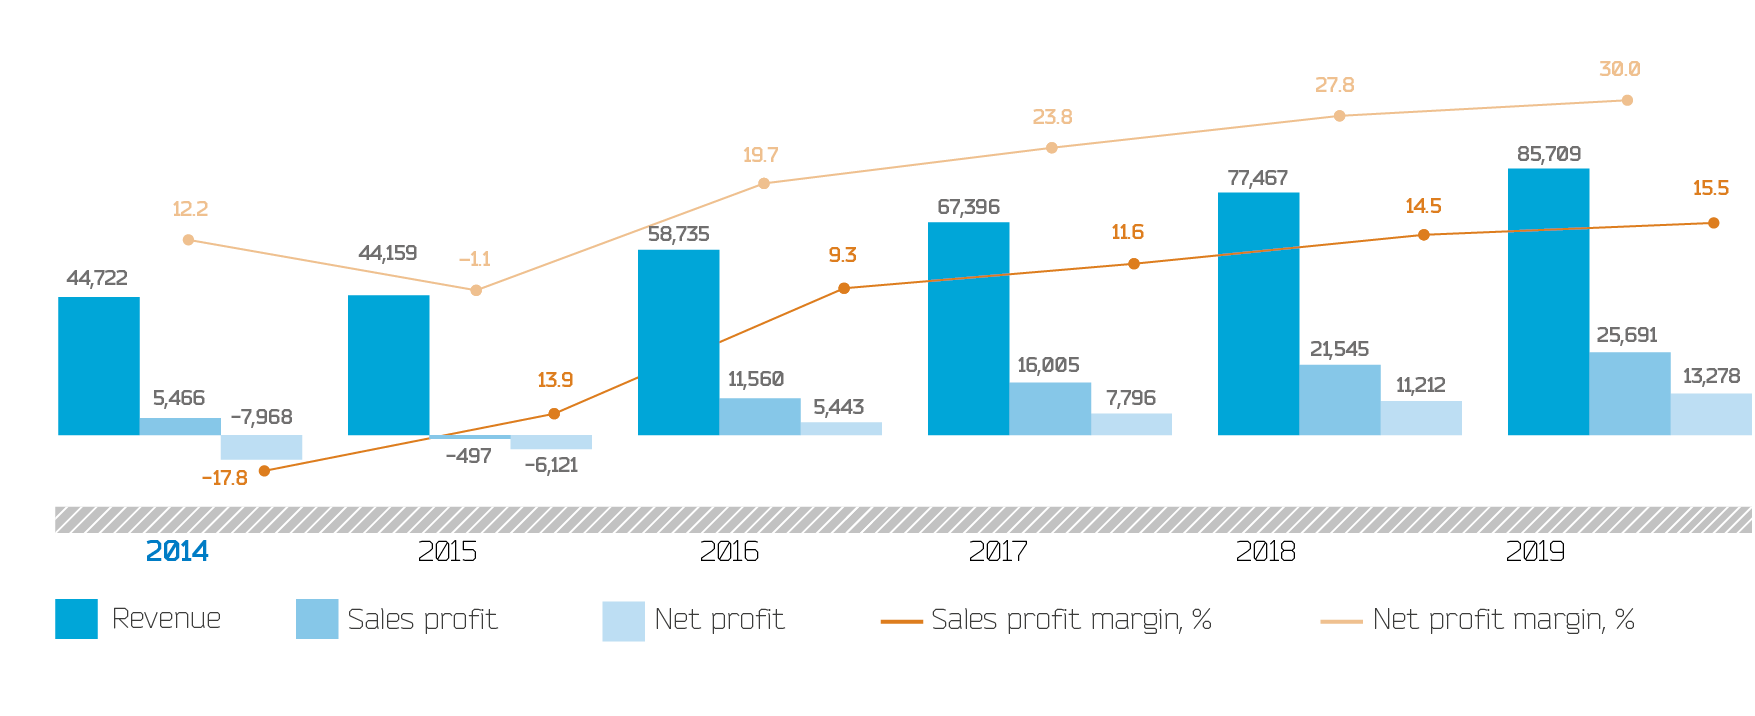
In the next five years, a gradual increase in EBITDA to RUB 39,310 mln in 2019 is forecasted with a parallel growth of EBITDA margin to 45.9% in 2019, which positively characterizes the financial position and performance results of the Company.
Thus, the share of net profit in the structure of EBITDA at the end of 2019 will increase to 33.8% (by the end of 2014 financial result of the Company was negative and has had a downward effect on the value of EBITDA), which is a positive feature of the Company’s financial position.
Significant improvement of financial results by 2019 is due to the essential growth of revenue from electricity transmission. Equity capital will also increase by 35.7%, and in 2019 ROE will reach its maximum value of 14.48% throughout
Dynamics of ROE is characterized by a steady growth trend throughout the considered period, and since 2016 the value of equity will also grow.
The indicators of Debt to equity ratio (total liabilities) for
The range of changes in the Company’s loan portfolio for
Since the dynamics of EBITDA in
The dynamics of Leverage in 2019 is characterized by a downward trend in terms of the advancing growth of equity capital to the debt.
Net assets for
Overall, the financial position of Lenenergo in 2019 compared to 2014 will improve, including due to the positive financial results from electricity transmission activities in the amount of RUB 9,616 mln against the loss from this type of activity received by the end of 2014.